Graphing Linear Equations by Plotting Points (Using a table of values)
Summary
TLDRThis instructional video teaches viewers how to graph linear equations by plotting points. It outlines the steps for both isolated and non-isolated Y equations, demonstrating the importance of selecting suitable X values for accurate Y calculations. Through practical examples, including cases with fractions, the video emphasizes the significance of plotting multiple points to verify the correctness of the graph. Additionally, it encourages viewers to practice and explore alternative graphing methods, reinforcing the foundational concept that every point on the line represents a solution to the equation.
Please replace the link and try again.
Q & A
What is the first step in graphing a linear equation?
-The first step is to find three points that are solutions to the equation by choosing values for X and substituting them into the equation to solve for Y.
Why is it recommended to use three points instead of just two when graphing?
-Using three points allows you to confirm your calculations. If one point is incorrect, the other two will not line up, indicating a mistake, whereas with only two points, you could still draw a line that doesn't represent the equation.
How should you choose X values when the equation includes a fraction?
-You should choose X values that are multiples of the denominator of the fraction, so the resulting Y values are integers and easier to plot.
What process should be followed when both X and Y are on the same side of the equation?
-First, isolate Y on one side of the equation, which simplifies finding integer points, and then follow the same steps to find points as in the previous examples.
What does it indicate if the plotted points do not line up?
-If the points do not line up, it indicates that there was an error in finding or plotting at least one of the points, and you need to check your work.
What happens if you randomly choose X values when graphing?
-Choosing X values randomly may lead to fractional Y values, which are harder to plot precisely. It's better to select values that avoid fractions.
Can you still graph a linear equation if the points have fractions?
-Yes, you can graph it even if the points have fractions, but it is generally more challenging to plot them accurately compared to using integer values.
What is the significance of drawing a line through the plotted points?
-Drawing a line through the plotted points shows that every point on the line is a solution to the equation, representing all possible solutions.
How do you ensure the Y values remain integers when working with fractions?
-By choosing X values that are multiples of the denominator in the fraction, you can ensure that the calculations for Y yield integer results.
What are some other methods to graph linear equations mentioned in the video?
-The video suggests checking links in the description for other methods to graph linear equations, implying that there are various techniques available beyond plotting points.
Outlines

This section is available to paid users only. Please upgrade to access this part.
Upgrade NowMindmap

This section is available to paid users only. Please upgrade to access this part.
Upgrade NowKeywords

This section is available to paid users only. Please upgrade to access this part.
Upgrade NowHighlights

This section is available to paid users only. Please upgrade to access this part.
Upgrade NowTranscripts

This section is available to paid users only. Please upgrade to access this part.
Upgrade NowBrowse More Related Video
ILLUSTRATING LINEAR EQUATIONS IN TWO VARIABLES || GRADE 8 MATHEMATICS Q1

Persamaan Garis Lurus (1) | Menggambar Grafik PGL | Matematika Kelas 8
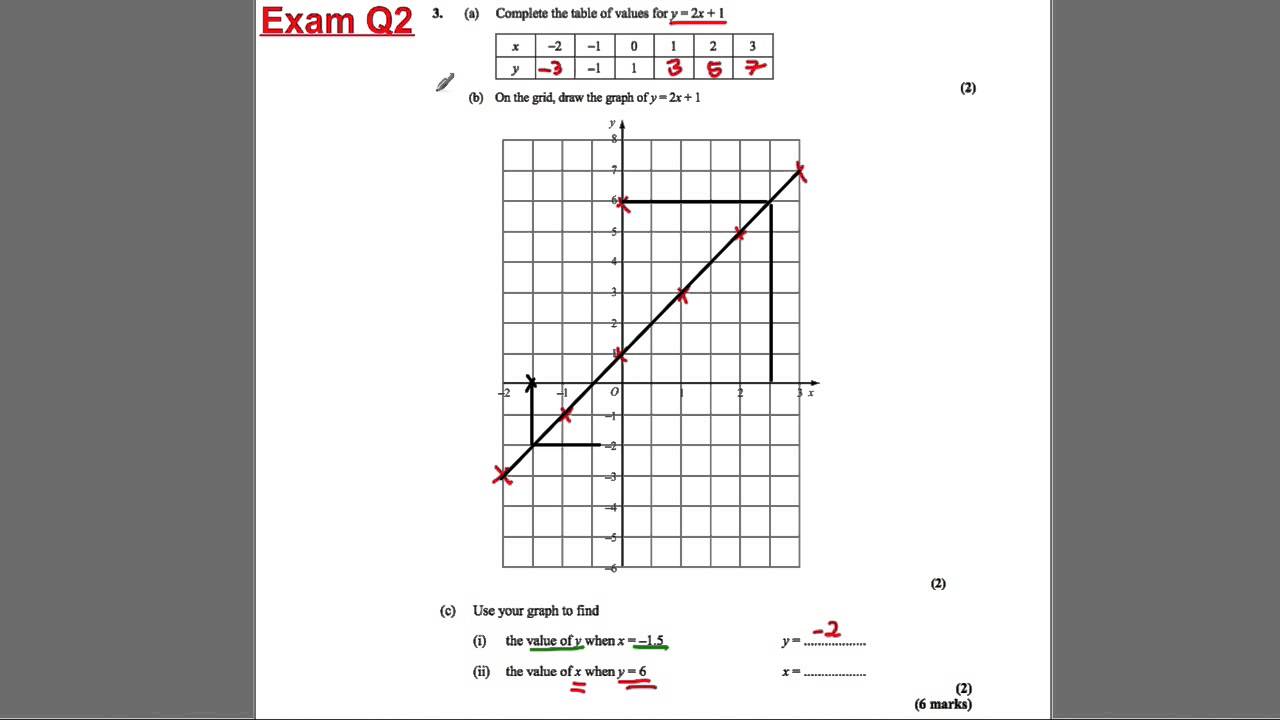
GCSE Revision Video 20 - Straight Line Graphs

1. MENGGAMBAR GRAFIK PERSAMAAN GARIS LURUS - PERSAMAAN GARIS LURUS - KELAS 8 SMP
Introduction to intercepts | Algebra I | Khan Academy

Persamaan Garis Lurus (Bentuk Umum)
5.0 / 5 (0 votes)