1. MENGGAMBAR GRAFIK PERSAMAAN GARIS LURUS - PERSAMAAN GARIS LURUS - KELAS 8 SMP
Summary
TLDRIn this educational video, Mira from Jakarta teaches viewers how to graph linear equations. She demonstrates step-by-step methods using various examples such as y = x - 2, 4x - 3y = 12, and others. Mira explains how to use tables to find coordinate pairs for graphing, and she covers different approaches for equations with fractions and real number solutions. The video includes clear visual aids, helping viewers understand how to plot the points and draw the graphs accurately, making it an ideal tutorial for learning linear graphing techniques.
Takeaways
- 😀 Using a table of values is an effective way to graph linear equations.
- 😀 Start by choosing simple values for x, such as 0, to calculate the corresponding y-values.
- 😀 For the equation y = x - 2, substitute x = 0 to find y = -2 and plot the point (0, -2).
- 😀 To find the x-value when y = 0, rearrange the equation and solve for x (e.g., x = 2 for y = x - 2).
- 😀 The graph of y = x - 2 passes through points (0, -2) and (2, 0).
- 😀 When dealing with a more complex equation like 4x - 3y = 12, substitute x = 0 and y = 0 to find key points.
- 😀 For the equation 4x - 3y = 12, when x = 0, y = -4, and when y = 0, x = 3, giving the points (0, -4) and (3, 0).
- 😀 For fractional equations like y = -3/2x + 2, using multiples of 2 for x makes calculations easier.
- 😀 In y = -3/2x + 2, when x = 0, y = 2, and when x = 2, y = -1, giving the points (0, 2) and (2, -1).
- 😀 The process of graphing remains the same regardless of whether the equation has whole numbers or fractions.
- 😀 After plotting the points, draw a straight line through them to represent the graph of the equation.
Q & A
What is the first step when graphing a linear equation like y = x - 2?
-The first step is to create a table with values for x and y. Typically, you start by substituting x = 0 into the equation to find the corresponding value for y.
Why is it helpful to use a table when graphing equations?
-A table helps organize the calculation process and ensures you can easily find pairs of x and y values, which are needed to plot points on the graph.
How do you find the y-coordinate when x = 0 in the equation y = x - 2?
-When x = 0, substitute it into the equation: y = 0 - 2, which gives y = -2. Thus, the coordinate is (0, -2).
What happens when you substitute y = 0 in the equation y = x - 2?
-Substituting y = 0 into the equation gives 0 = x - 2. Solving for x, you get x = 2, so the coordinate is (2, 0).
How do you graph the equation y = x - 2 after finding the points (0, -2) and (2, 0)?
-Plot the points (0, -2) and (2, 0) on the graph and then draw a straight line through them, as the equation represents a straight line.
In the equation 4x - 3y = 12, how do you find the y-coordinate when x = 0?
-Substitute x = 0 into the equation: 4(0) - 3y = 12, which simplifies to -3y = 12. Solving for y gives y = -4, so the coordinate is (0, -4).
How do you find the x-coordinate when y = 0 in the equation 4x - 3y = 12?
-Substitute y = 0 into the equation: 4x - 3(0) = 12, which simplifies to 4x = 12. Solving for x gives x = 3, so the coordinate is (3, 0).
Why is it necessary to choose different x-values when graphing equations like y = -3/2x + 2?
-Choosing different x-values helps you find a range of points to plot, especially when the equation involves fractions or decimals. This ensures the line is accurately represented.
In the equation y = -3/2x + 2, what happens when x = 0?
-Substitute x = 0 into the equation: y = -3/2(0) + 2, which simplifies to y = 2. So, the coordinate is (0, 2).
How do you handle fractional coefficients when graphing equations like y = -3/2x + 2?
-To make calculations easier, choose x-values that are multiples of the denominator of the fraction (e.g., multiples of 2 for -3/2x). This simplifies the arithmetic and makes the graphing process smoother.
Outlines

This section is available to paid users only. Please upgrade to access this part.
Upgrade NowMindmap

This section is available to paid users only. Please upgrade to access this part.
Upgrade NowKeywords

This section is available to paid users only. Please upgrade to access this part.
Upgrade NowHighlights

This section is available to paid users only. Please upgrade to access this part.
Upgrade NowTranscripts

This section is available to paid users only. Please upgrade to access this part.
Upgrade NowBrowse More Related Video

2. PENGERTIAN GRADIEN - GRADIEN MELALUI 1 TITIK, 2 TITIK DAN DARI PERSAMAAN GARIS - PGL-KELAS 8 SMP
X- AND Y- INTERCEPTS OF GRAPHS OF POLYNOMIAL FUNCTION|| GRADE 10 MATHEMATICS Q2
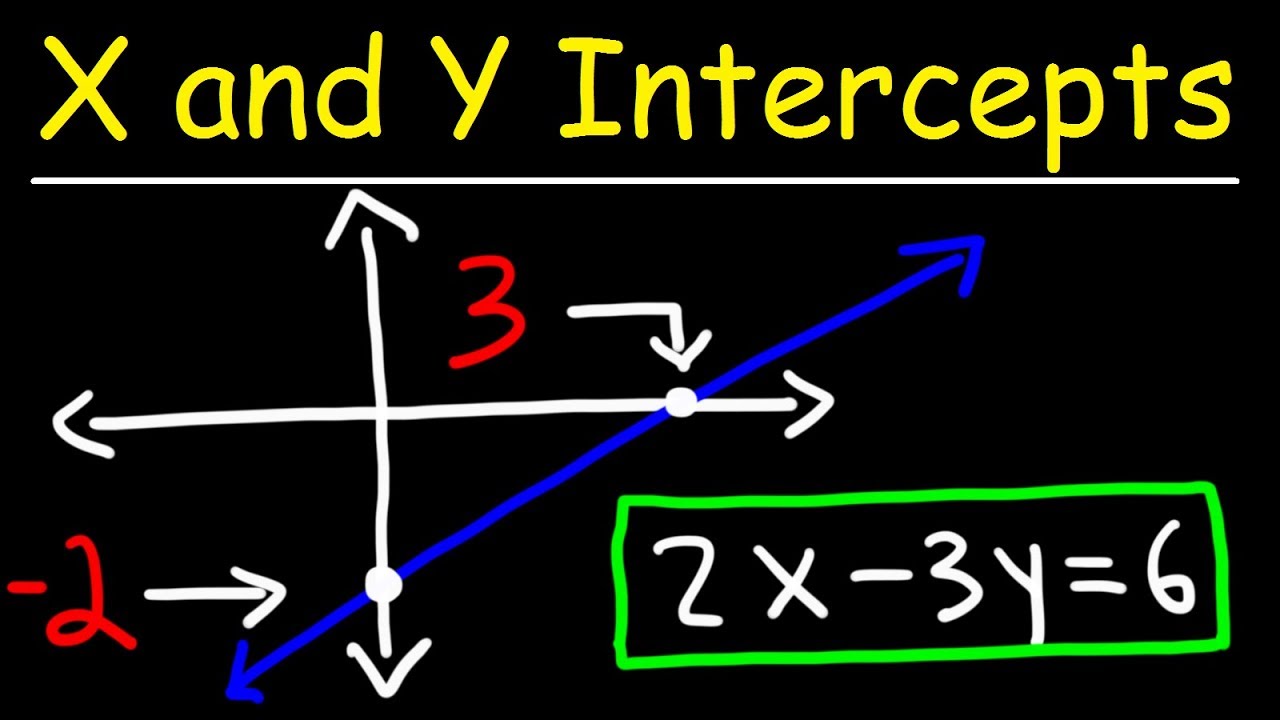
How To Find The X and Y Intercepts of a Line
SPtDV • Part 3: Cara Menentukan Pertidaksamaan Dua Variabel dari Grafik Daerah Penyelesaian
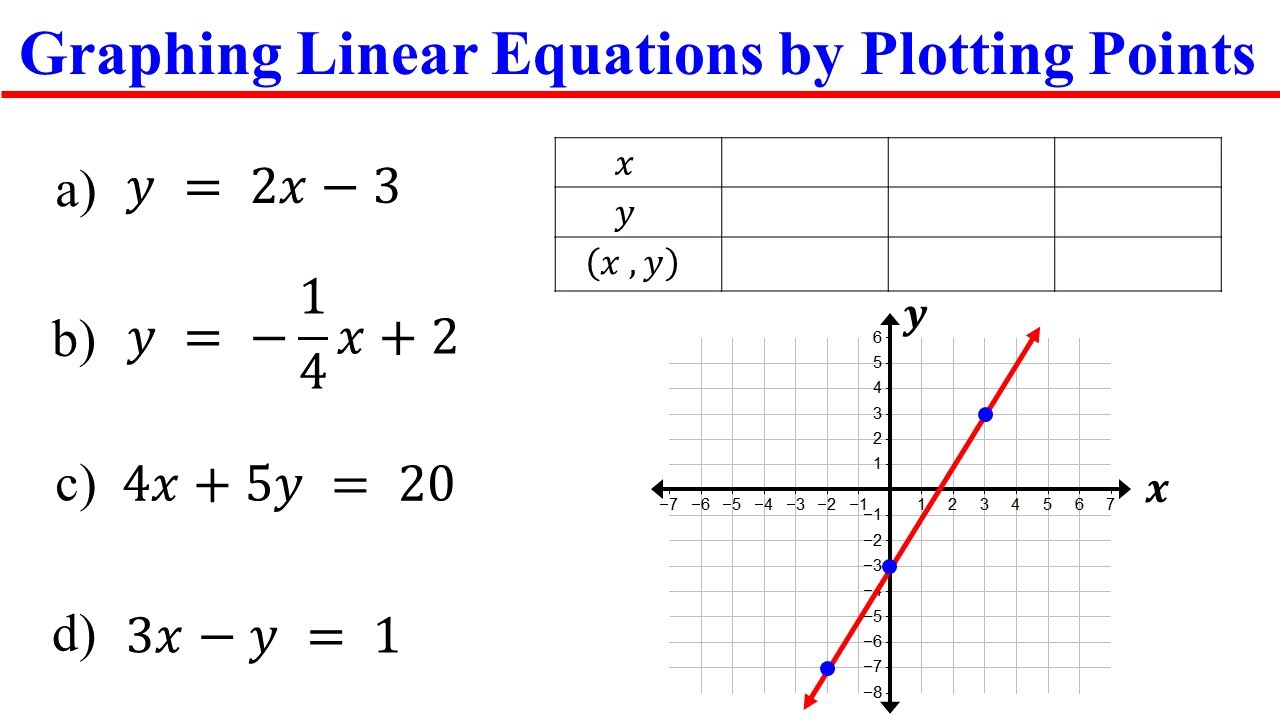
Graphing Linear Equations by Plotting Points (Using a table of values)

Kurikulum Merdeka Matematika Kelas 8 Bab 5 Persamaan Garis Lurus
5.0 / 5 (0 votes)