Hypothesis Testing: Calculations and Interpretations| Statistics Tutorial #13 | MarinStatsLectures
Summary
TLDRThis video explains the process of conducting a one-sample t-test for hypothesis testing, using BMI data as an example. It walks through how to set up null and alternative hypotheses, calculate test statistics, and interpret p-values. The video emphasizes the importance of understanding statistical significance versus scientific or clinical significance. It concludes by discussing the relevance of confidence intervals and the types of errors that can occur during hypothesis testing, providing a foundation for future lessons on hypothesis testing and data analysis using software.
Takeaways
- 📊 Hypothesis tests help determine if a change in data is statistically significant or due to random chance.
- 🎯 The null hypothesis (H₀) assumes no change from a previous state, while the alternative hypothesis (Hₐ) suggests a change.
- 📈 In this example, the mean BMI in the US in 2008 was 25.3, and the study seeks to determine if it increased by 2018.
- 🧪 A sample of 25 individuals in 2018 shows a mean BMI of 27.8 with a sample standard deviation of 6.
- 📉 The t-test compares the observed sample mean (27.8) with the hypothesized mean (25.3) to check if the increase is statistically significant.
- 🧮 The test statistic calculated is 2.08, meaning the sample mean is 2 standard errors above the hypothesized value.
- 📊 The p-value represents the probability of obtaining the observed sample mean or greater if the null hypothesis is true. Here, it's approximately 1.9%.
- 🚫 Since the p-value is small (< 5%), we reject the null hypothesis and conclude there is evidence that the BMI has increased.
- 📌 The distinction between statistical significance (p-value) and practical or clinical significance is important for real-world interpretation.
- 📐 Confidence intervals offer a range of plausible values for the true population mean, further assisting in evaluating the meaningfulness of the result.
Q & A
What is the purpose of a one-sample t-test?
-The one-sample t-test is used to determine if the mean of a sample is significantly different from a known or hypothesized population mean.
In the example provided, what was the sample size and the sample mean for BMI in 2018?
-The sample size was 25 individuals, and the sample mean for BMI in 2018 was 27.8.
What is the null hypothesis (H₀) and the alternative hypothesis (Hₐ) in this example?
-The null hypothesis (H₀) is that the mean BMI in 2018 has not changed from the 2008 value of 25.3. The alternative hypothesis (Hₐ) is that the mean BMI in 2018 is larger than it was in 2008, indicating an increase.
Why do we start by assuming the null hypothesis is true?
-We start by assuming the null hypothesis is true because it allows us to compare what we actually observe (sample mean) to what we would expect if there were no change. If the data significantly deviates from what is expected under the null, we can provide evidence against it.
What is the test statistic, and how is it calculated in this example?
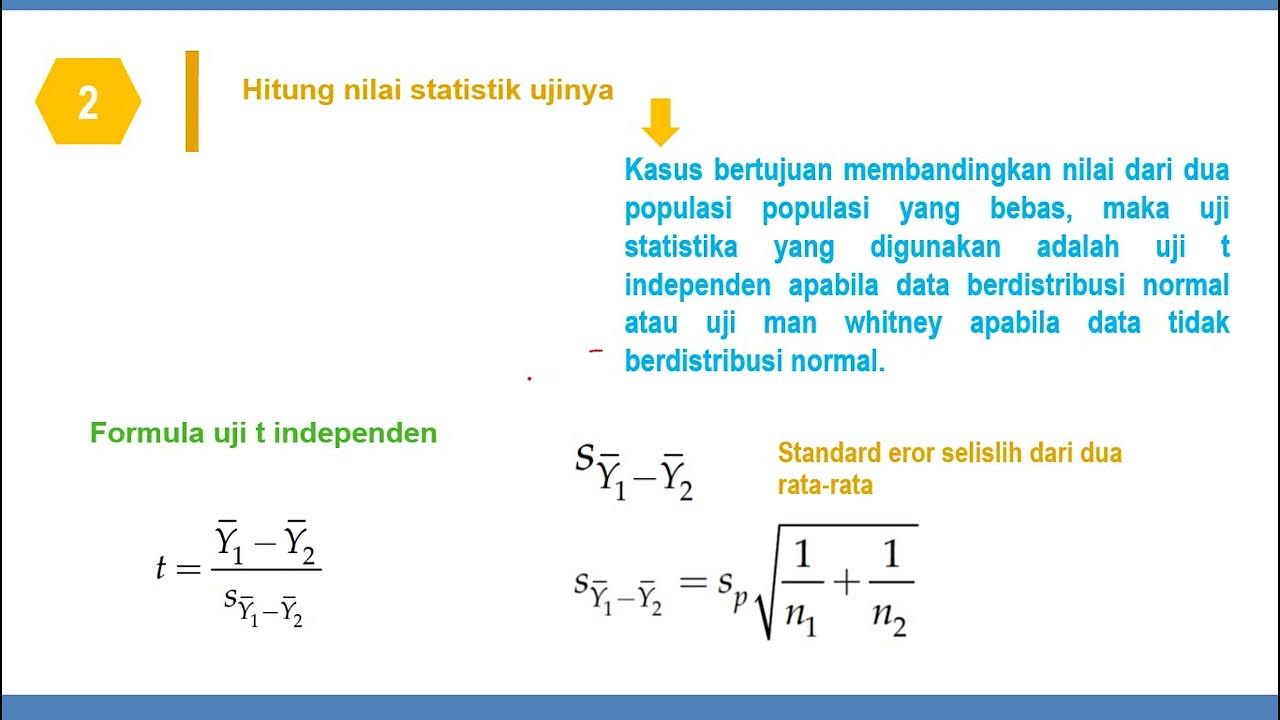
-The test statistic is a standardized value that compares the difference between the sample mean (27.8) and the hypothesized population mean (25.3) relative to the standard error. In this example, the test statistic is 2.08, indicating that the sample mean is 2.08 standard errors away from the hypothesized value.
What does the p-value represent, and what was the p-value in this example?
-The p-value represents the probability of observing a sample mean as extreme as 27.8 or greater if the null hypothesis is true. In this example, the p-value is approximately 1.9% (using the Z-distribution) or 2.4% (using the t-distribution).
What decision is made based on the p-value in this example?
-Since the p-value is small (less than 5%), the null hypothesis is rejected. This suggests that there is evidence to believe the mean BMI has increased between 2008 and 2018.
How do we interpret a small p-value in hypothesis testing?
-A small p-value indicates that if the null hypothesis were true, the observed sample result would be very unlikely to occur. Therefore, we conclude that the null hypothesis is likely false, and there is evidence to support the alternative hypothesis.
What is the difference between statistical significance and practical significance?
-Statistical significance means that the observed difference is unlikely to be due to chance alone, while practical (or clinical) significance refers to whether the observed difference is meaningful or important in a real-world context.
Why is it important to consider both statistical and clinical significance when interpreting results?
-It’s important because a result can be statistically significant but may not have a meaningful or impactful effect in practice. For example, in this study, while the BMI increase is statistically significant, the practical significance depends on whether the increase is large enough to be considered clinically relevant.
Outlines

This section is available to paid users only. Please upgrade to access this part.
Upgrade NowMindmap

This section is available to paid users only. Please upgrade to access this part.
Upgrade NowKeywords

This section is available to paid users only. Please upgrade to access this part.
Upgrade NowHighlights

This section is available to paid users only. Please upgrade to access this part.
Upgrade NowTranscripts

This section is available to paid users only. Please upgrade to access this part.
Upgrade Now5.0 / 5 (0 votes)


