independen t test menggunakan SPSS
Summary
TLDRThis video discusses the concept of statistical testing for comparing two independent populations, focusing on the independent sample t-test and the Mann-Whitney test. It explains when to use each test, based on the distribution and scale of the data. The script outlines the process of hypothesis testing, including the formulation of null and alternative hypotheses, checking for normality, and conducting tests using SPSS. An example of testing the effectiveness of two teaching methods is presented, showing how to interpret SPSS output and make conclusions based on statistical results.
Takeaways
- 😀 The script discusses the concept of testing two independent populations in statistics, comparing the values of two separate groups.
- 😀 Independent populations are those where data is collected from two different groups that have no relationship with each other.
- 😀 An example is provided where one group uses a conventional learning method and the other uses a new integrated learning method, comparing the effectiveness of both methods.
- 😀 The hypothesis for testing is whether there is a significant difference in value improvement between the new method and the conventional method.
- 😀 The null hypothesis states there is no significant difference between the two methods, while the alternative hypothesis suggests there is a difference.
- 😀 The script emphasizes the importance of determining whether the data distribution is normal before choosing the appropriate statistical test (Independent T-test or Mann-Whitney).
- 😀 The Shapiro-Wilk test is used for checking normality when sample sizes are small (less than 250), and the significance value helps determine whether the assumption of normality holds.
- 😀 If the data is normally distributed, an Independent T-test can be used to compare the means of the two groups, provided the variances are homogeneous.
- 😀 If the normality assumption is not met, the Mann-Whitney test (a non-parametric test) is used instead to compare the groups.
- 😀 In the case where normality is confirmed, and the variances are homogeneous, the Independent T-test output is used to compare the groups and decide whether to reject the null hypothesis.
- 😀 The script concludes that if the p-value is greater than the significance level (α), the null hypothesis is accepted, meaning there is insufficient evidence to prove a significant difference between the two learning methods.
Q & A
What is the main focus of this script?
-The script primarily discusses statistical methods for comparing two independent populations, including how to perform hypothesis testing, check for normality, and interpret results using various statistical tests like the independent sample t-test and Mann-Whitney test.
What does 'independent populations' mean in statistical terms?
-'Independent populations' refers to two distinct groups from which samples are taken and compared, where the data from one group is not influenced by the data from the other group.
What are the two main types of statistical tests mentioned for comparing two independent populations?
-The two main types of statistical tests discussed are the parametric independent sample t-test and the non-parametric Mann-Whitney test.
When should the Mann-Whitney test be used instead of the independent sample t-test?
-The Mann-Whitney test should be used when the data does not follow a normal distribution, while the independent sample t-test is used when the data is normally distributed.
What is the role of hypothesis testing in this context?
-Hypothesis testing is used to determine whether there is a statistically significant difference between the two populations. The null hypothesis (H0) suggests no difference, while the alternative hypothesis (H1) suggests a difference exists.
How is normality checked for the data?
-Normality is checked using statistical tests such as the Shapiro-Wilk test, which is suitable for small sample sizes (less than 250). The results from these tests help determine whether parametric tests like the t-test can be used.
What are the key assumptions for conducting an independent sample t-test?
-The key assumptions for conducting an independent sample t-test are that the data should be on an interval or ratio scale, and that the data from each group should follow a normal distribution.
How are the groups categorized for analysis in SPSS?
-In SPSS, the groups are categorized by assigning codes to each group, such as '1' for the conventional method and '2' for the new method. This allows the software to distinguish between the two groups during analysis.
What does the significance level (alpha) of 0.05 indicate in hypothesis testing?
-A significance level (alpha) of 0.05 indicates the threshold for determining statistical significance. If the p-value is less than 0.05, the null hypothesis is rejected, suggesting a significant difference. If the p-value is greater than 0.05, the null hypothesis is not rejected.
What does it mean if the p-value is greater than the significance level in hypothesis testing?
-If the p-value is greater than the significance level (alpha), the null hypothesis is not rejected. This means there is not enough evidence to claim a significant difference between the two groups being compared.
Outlines

This section is available to paid users only. Please upgrade to access this part.
Upgrade NowMindmap

This section is available to paid users only. Please upgrade to access this part.
Upgrade NowKeywords

This section is available to paid users only. Please upgrade to access this part.
Upgrade NowHighlights

This section is available to paid users only. Please upgrade to access this part.
Upgrade NowTranscripts

This section is available to paid users only. Please upgrade to access this part.
Upgrade NowBrowse More Related Video

Cara Uji Beda Dua Kelompok dengan Jamovi | Independent Sample t-test dan Paired Sample t-test
KULIAH STATISTIK - ANALISIS T-TEST
Two Sample t-test for Independent Groups | Statistics Tutorial #23| MarinStatsLectures
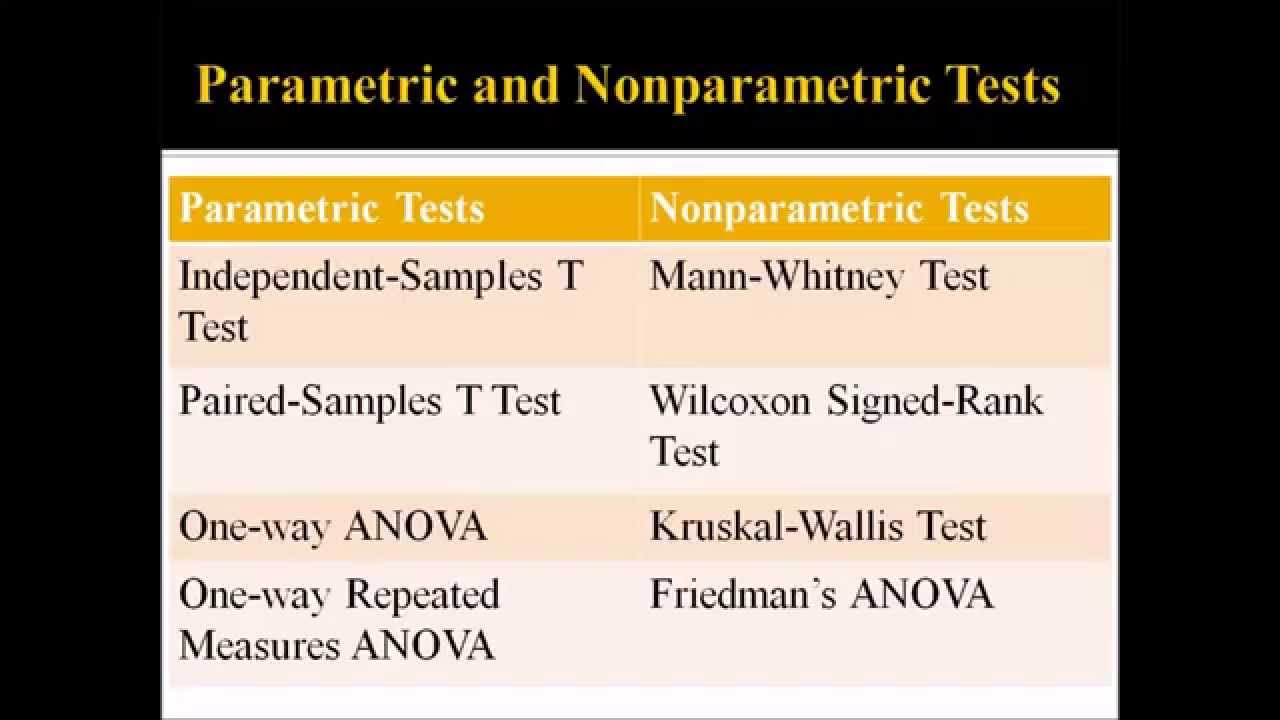
Parametric and Nonparametric Statistical Tests

Tutorial Analisis Independent Sample t test dengan JASP

Independent-samples t-test in SPSS
5.0 / 5 (0 votes)