Uji Perbandingan One Sample t Test
Summary
TLDRThis lecture focuses on the One Sample t-Test in statistics, explaining its role in hypothesis testing to compare sample data with a constant population value. The speaker covers essential concepts such as the assumptions required for using parametric tests (e.g., normal distribution and interval/ratio data types), as well as types of data like nominal, ordinal, interval, and ratio. Key aspects include hypothesis formulation, the importance of significance levels (α), and interpreting results using statistical formulas and degrees of freedom (DF). This session is crucial for understanding the application of t-tests in comparing population parameters and conducting statistical analyses.
Takeaways
- 😀 One-sample t-test is used to compare the mean of a sample to a known value or constant, such as determining if the average salary in a factory exceeds a certain threshold.
- 😀 Hypothesis testing involves comparing two hypotheses: null hypothesis (H0) and alternative hypothesis (H1). The null hypothesis typically assumes equality, while the alternative assumes a difference.
- 😀 The key assumption for using parametric tests like the one-sample t-test is that the data is normally distributed. If not, non-parametric tests should be used.
- 😀 Data types are classified into four categories: nominal, ordinal, interval, and ratio. One-sample t-tests work with interval or ratio data, which are numeric.
- 😀 The one-sample t-test is applicable when comparing a sample's mean to a constant, such as whether the average weight of students differs from a standard weight.
- 😀 A normality test is used to check if the data follows a normal distribution before applying the one-sample t-test.
- 😀 In hypothesis testing, the alternative hypothesis (H1) often involves a directional test (one-tailed) or non-directional (two-tailed), determining the direction of the difference or equality.
- 😀 The concept of 'alpha' (α) is essential in hypothesis testing, representing the level of significance (commonly set at 0.05) to determine whether to reject the null hypothesis.
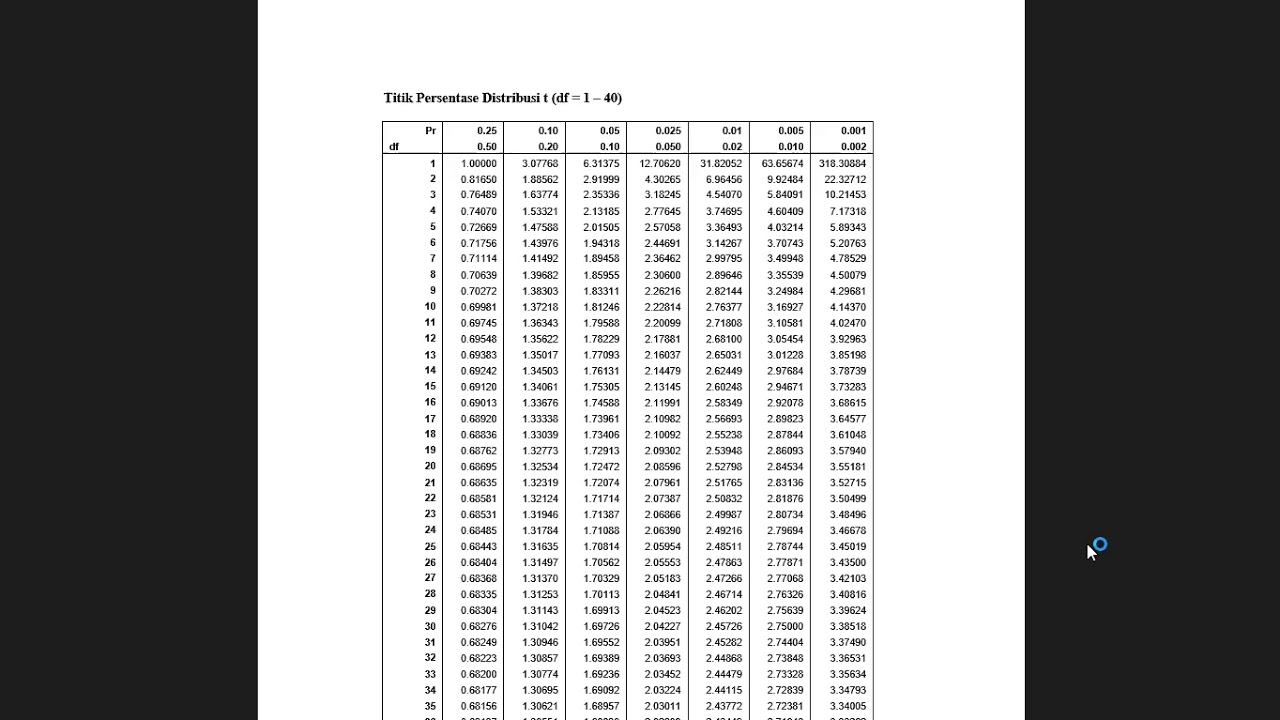
- 😀 Degrees of freedom (DF) in statistical tests like the one-sample t-test are calculated as the sample size minus 1 (n-1).
- 😀 The process of determining the appropriate hypothesis direction (one-sided or two-sided) depends on the research question, such as whether a value is greater than or less than a constant.
Q & A
What is the main focus of the lesson discussed in the transcript?
-The lesson focuses on one-sample t-test as a statistical method for comparing the mean of a sample to a known value or population parameter.
What are the two types of statistical tests mentioned in the script?
-The two types of statistical tests mentioned are parametric and non-parametric tests. The lesson focuses on the parametric one-sample t-test.
What assumptions must be met when conducting a one-sample t-test?
-The data must follow a normal distribution, and the data type should be interval or ratio. Additionally, the population variance should be unknown.
How do you check if the data follows a normal distribution before applying a parametric test?
-One can use a normality test or statistical software to verify if the data follows a normal distribution before applying a parametric test.
What is the difference between interval data and ratio data?
-Interval data refers to numerical data where the intervals between values are consistent, such as temperature. Ratio data is similar but has a true zero point, like height or weight.
How are ordinal and nominal data different from interval and ratio data?
-Ordinal and nominal data are non-numeric, qualitative data. Ordinal data can be ranked, while nominal data consists of categories without a natural order.
What is the null hypothesis (H0) in a one-sample t-test?
-The null hypothesis in a one-sample t-test states that the population mean is equal to a specific constant value. It is usually expressed as H0: μ = μ0.
How do you determine whether to reject or accept the null hypothesis in a t-test?
-If the t-statistic exceeds the critical value (t_alpha/2) for a two-tailed test or t_alpha for a one-tailed test, the null hypothesis is rejected. Otherwise, it is accepted or failed to be rejected.
What is the significance of 'alpha' in hypothesis testing?
-'Alpha' represents the significance level, typically set at 0.05. It defines the probability threshold for rejecting the null hypothesis. A smaller alpha value increases the test's accuracy.
How does the one-sample t-test relate to comparing population means?
-The one-sample t-test compares the mean of a sample to a known population mean or a constant value to determine if there is a statistically significant difference.
Outlines

This section is available to paid users only. Please upgrade to access this part.
Upgrade NowMindmap

This section is available to paid users only. Please upgrade to access this part.
Upgrade NowKeywords

This section is available to paid users only. Please upgrade to access this part.
Upgrade NowHighlights

This section is available to paid users only. Please upgrade to access this part.
Upgrade NowTranscripts

This section is available to paid users only. Please upgrade to access this part.
Upgrade NowBrowse More Related Video
Uji beda mean 1 sampel dan T dependent

Pertemuan 6 Uji Mean One Sample T-Test

Pengujian Hipotesis Deskriptif Satu Sampel

Test of Hypothesis (Bangla)∣ Z test ∣ Basic Class ∣ Business Statistics ∣ Research Methodology ∣

[PART 2] KONSEP DASAR STATISTIKA INFERENSIA
Uji T (T-Test) Konsep Dasar, Contoh Kasus dan Penerapan Menggunakan SPSS
5.0 / 5 (0 votes)