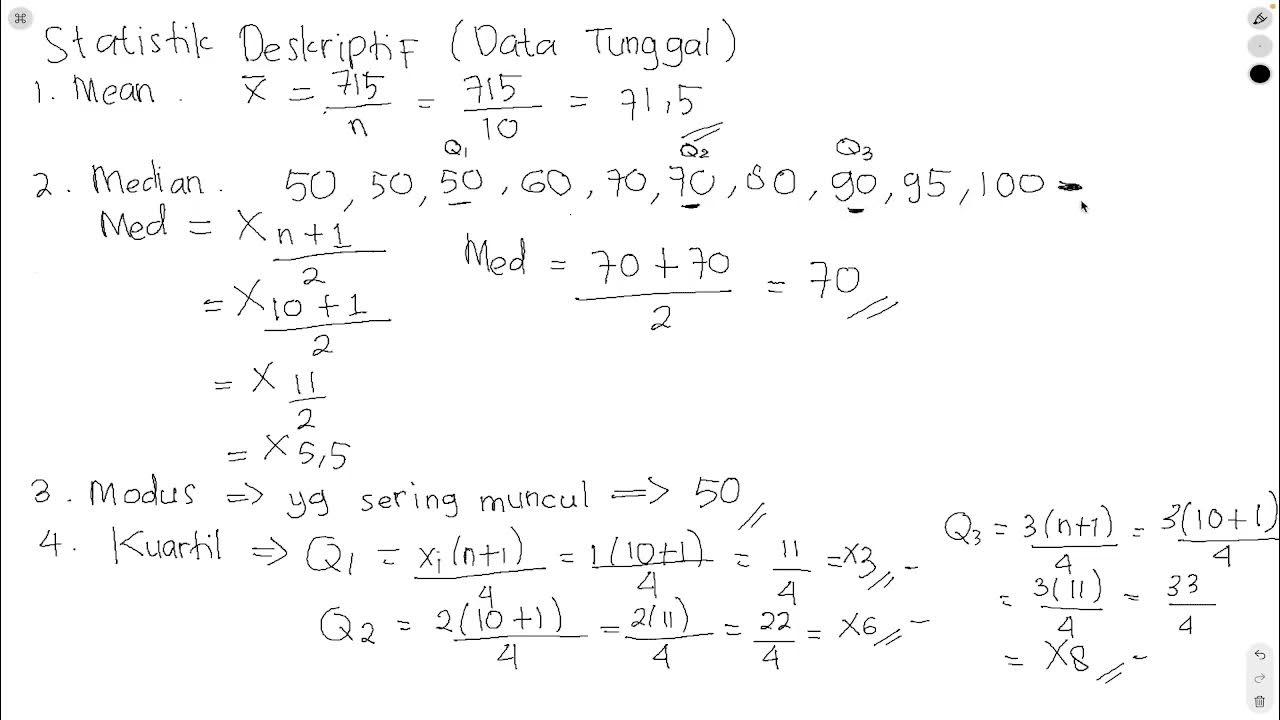
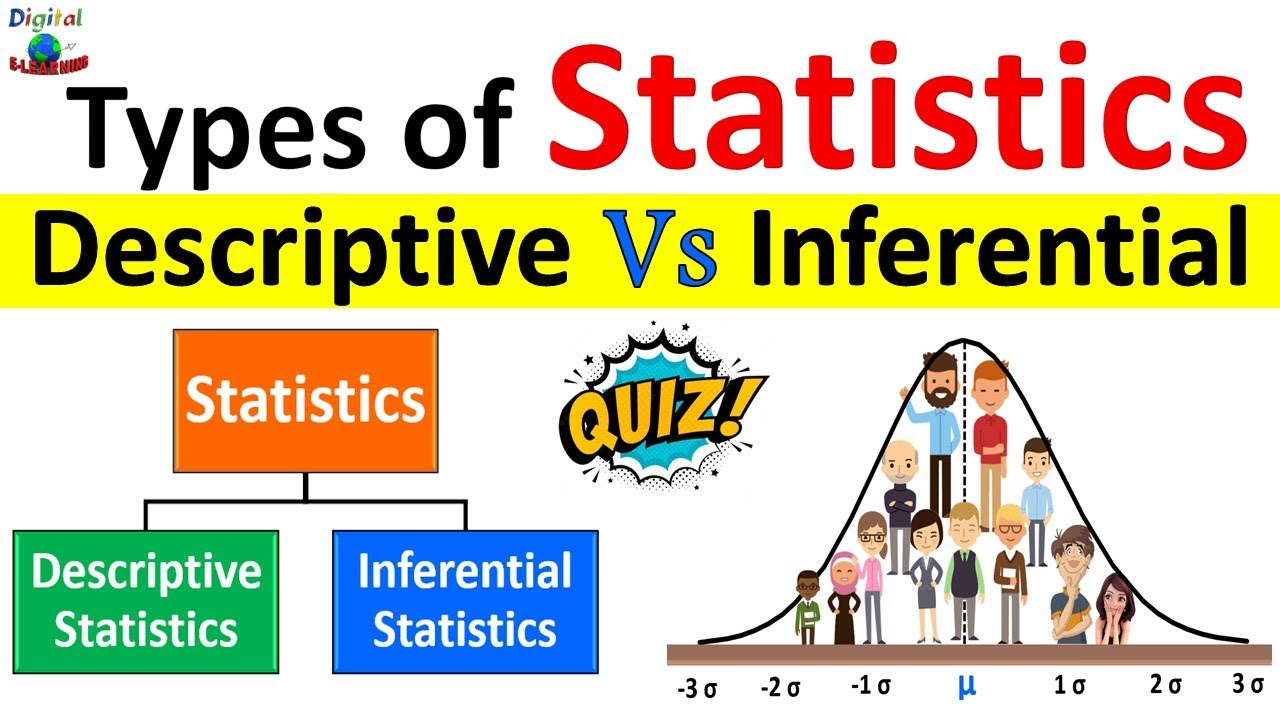
Measures of Variability (Range, Standard Deviation, Variance)
Summary
TLDRThis video script delves into measures of variability, a crucial aspect of descriptive statistics that complements measures of central tendency. It emphasizes the importance of understanding data spread and consistency, using examples like clustered and spread-out datasets, and the choice between two medications with different improvement variabilities. The script introduces the range as a simple measure of variability, highlighting its limitations and the need for more nuanced metrics like standard deviation and variance. These measures provide deeper insights into data distribution, especially in normally distributed datasets, where they can predict the percentage of data points within certain intervals from the mean.
Takeaways
- 📊 Measures of variability are essential in descriptive statistics to understand the dispersion of data, in addition to measures of central tendency like the mean.
- 🌟 Two datasets can have the same mean but different variability, which is crucial for understanding the data's distribution.
- 💊 Variability is important in real-life decisions, such as choosing between medications with similar effectiveness but different consistency.
- 🔢 The range is a simple measure of variability calculated as the difference between the highest and lowest values in a dataset.
- 🚫 A limitation of the range is that it might not fully represent the dataset, especially if there are outliers or if the data is not evenly distributed.
- 📉 Standard deviation is a measure that describes the typical amount by which data points deviate from the mean and is more informative than the range.
- 📚 The standard deviation is particularly useful in understanding normally distributed data, such as height and weight, providing insights into what is common and uncommon.
- 📊 One standard deviation from the mean covers approximately 68% of the data in a normal distribution, two standard deviations cover about 95%, and three cover around 99.7%.
- 🧮 Variance is calculated as the square of the standard deviation and represents the average squared deviation from the mean.
- 📘 The formulas for standard deviation and variance differ for population and sample data, with the population version using the Greek letter Sigma (σ) and the sample version using 's'.
Q & A
Why are measures of variability important in statistics?
-Measures of variability are important because they provide a way to quantify the differences in a dataset, which cannot be captured by measures of central tendency alone, such as the mean. They describe how scores in a dataset differ from one another and can indicate how spread out or clustered the data points are.
What is the difference between the datasets with a mean of 87 in the video example?
-In the video, the top dataset has scores that are very clustered together, indicating low variability, while the bottom dataset has scores that are spread out, indicating high variability. Despite both having the same mean, the distribution of scores is quite different, highlighting the need for measures of variability.
Why might someone choose medication B over medication A in the pharmaceutical example?
-In the pharmaceutical example, even though the mean improvement scores for medications A and B are the same, medication B is chosen because it shows less variability in improvement. This suggests that medication B provides a more consistent effect across patients, which is often a desirable quality in medical treatments.
What is the range and how is it calculated?
-The range is a simple measure of variability that represents the difference between the highest and lowest values in a dataset. It is calculated by subtracting the lowest value (L) from the highest value (H), as shown by the formula R = H - L.
What is the limitation of using the range as a measure of variability?
-The limitation of the range is that it only considers the highest and lowest values in a dataset, potentially missing out on other important information about the distribution of the data. It does not account for the distribution of scores in between the extremes.
What is standard deviation and why is it useful?
-Standard deviation is a measure of variability that describes the typical amount by which scores deviate from the mean. It is useful because it provides a more comprehensive view of the dataset's dispersion than the range. It is particularly informative in normally distributed data, where it can indicate the proportion of data points within certain intervals from the mean.
What does it mean for a dataset to be normally distributed?
-A dataset is normally distributed if it follows a specific bell-shaped curve, often referred to as the normal curve. This distribution is characterized by the mean, median, and mode being the same, and the data points symmetrically distributed around the mean.
How do standard deviations relate to the normal distribution?
-In a normally distributed dataset, standard deviations provide insights into the commonality of data points. For instance, about 68% of data points fall within one standard deviation of the mean, 95% within two standard deviations, and 99.7% within three standard deviations.
What is variance and how is it different from standard deviation?
-Variance is the average squared deviation from the mean. It is calculated as the square of the standard deviation. Unlike standard deviation, which is in the same units as the data, variance is in squared units, making it less intuitive but useful for certain statistical calculations.
What are the formulas for calculating standard deviation and variance in a population?
-The formula for population standard deviation is Σ(x - μ)^2 / N, where Σ represents the sum, x is each value in the dataset, μ is the mean, and N is the number of observations. The formula for population variance is Σ(x - μ)^2 / N, which is the same as standard deviation but used to describe the spread of the data in squared units.
What are the differences between population and sample standard deviation formulas?
-The population standard deviation formula divides by the total number of observations (N), while the sample standard deviation formula divides by the number of observations minus one (N-1). This difference accounts for the additional uncertainty introduced by estimating from a sample rather than the entire population.
Outlines

This section is available to paid users only. Please upgrade to access this part.
Upgrade NowMindmap

This section is available to paid users only. Please upgrade to access this part.
Upgrade NowKeywords

This section is available to paid users only. Please upgrade to access this part.
Upgrade NowHighlights

This section is available to paid users only. Please upgrade to access this part.
Upgrade NowTranscripts

This section is available to paid users only. Please upgrade to access this part.
Upgrade NowBrowse More Related Video

Statistik Deskriptif

Ukuran Dispersi dan Variasi

Descriptive Statistics [Simply explained]

STATISTIK DESKRIPTIF (MEAN, MEDIAN, MODE, KUARTIL, VARIAN, STANDAR DEVIASI) UNTUK DATA TUNGGAL

Statistics - Module 3 - Numerical Summaries

Descriptive Statistics vs Inferential Statistics | Measure of Central Tendency | Types of Statistics
5.0 / 5 (0 votes)