STATISTIK DESKRIPTIF (MEAN, MEDIAN, MODE, KUARTIL, VARIAN, STANDAR DEVIASI) UNTUK DATA TUNGGAL
Summary
TLDRThis educational video script delves into descriptive statistics, a method for analyzing and summarizing data from samples or populations. It covers key statistical measures including mean, median, mode, and quartiles, which help describe the central tendency and dispersion of data. The script also explains how to calculate variance and standard deviation, illustrating data spread and consistency. Additionally, it introduces the creation of pie charts to visually represent categorized data, enhancing data readability. The tutorial aims to provide a clear understanding of descriptive statistics through step-by-step explanations and examples.
Takeaways
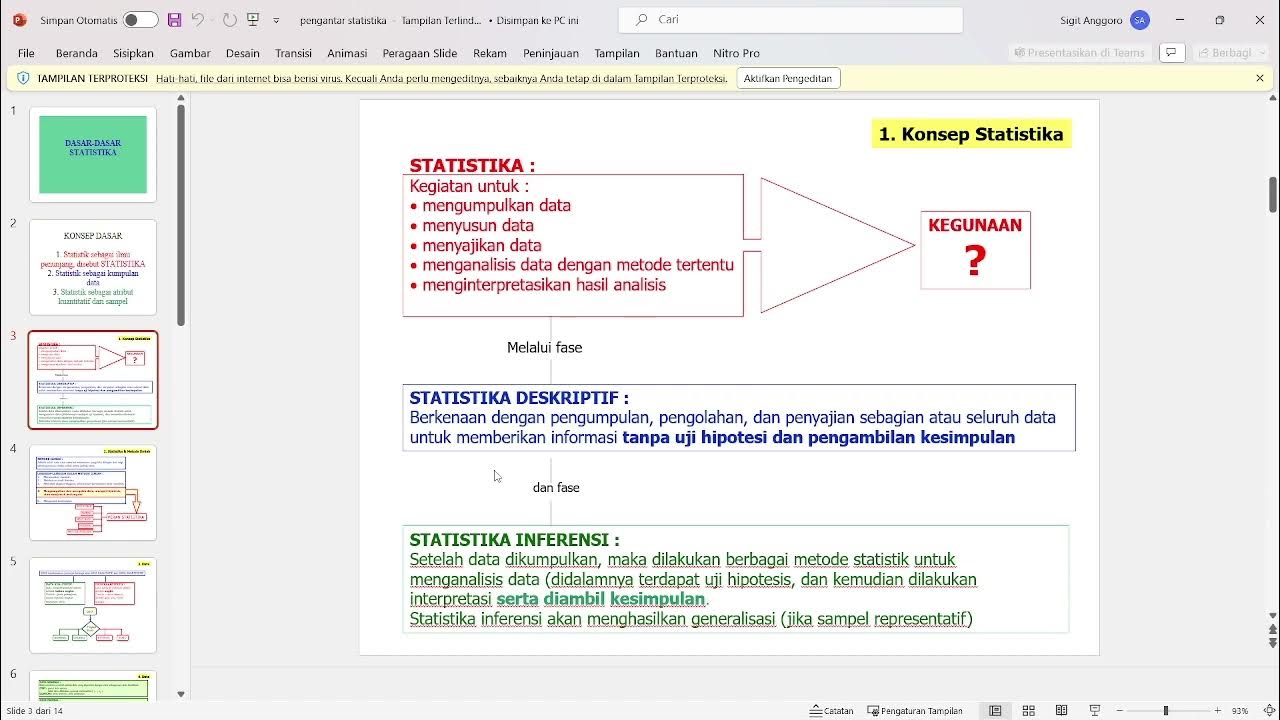
- 📊 Descriptive statistics is a method of data analysis aimed at describing objects or phenomena based on sample or population data collected in research.
- 🔢 Mean (average) is calculated by summing all the data points and dividing by the number of data points.
- 📈 Median is the middle value in a data set when the numbers are arranged in ascending order.
- 🏆 Mode is the value that appears most frequently in a data set.
- 📊 Quartiles divide the data set into four equal parts and are used to understand the distribution of the data.
- 📉 Variance measures the spread of data points around the mean, indicating how much the data varies.
- 📌 Standard deviation is the square root of the variance and represents the average amount of variation from the mean.
- 📊 A pie chart is a circular diagram that shows how data points are categorized and can be used to visualize data distribution.
- 📚 The script provides a step-by-step guide on how to calculate mean, median, mode, quartiles, variance, and standard deviation for a given data set.
- 🎯 The script concludes with an example of creating a pie chart to visually represent the data, emphasizing the importance of understanding descriptive statistics for data analysis.
Q & A
What is descriptive statistics?
-Descriptive statistics is a branch of statistics that aims to describe, summarize, and organize data from a sample or population within a research study.
What are the main measures of central tendency in descriptive statistics?
-The main measures of central tendency in descriptive statistics include the mean, median, and mode. The mean is the average of the data, the median is the middle value when the data is ordered, and the mode is the value that occurs most frequently.
How is the mean calculated in descriptive statistics?
-The mean (average) is calculated by summing all the values in the dataset and then dividing by the total number of values (n).
Can you explain how to determine the median in a dataset?
-To determine the median, first, arrange the data in ascending order. If the number of data points is odd, the median is the middle value. If even, the median is the average of the two middle values.
What does the mode represent in a dataset?
-The mode represents the value that appears most frequently in a dataset. It is the value with the highest frequency.
What is the purpose of quartiles in descriptive statistics?
-Quartiles divide the dataset into four equal parts. They help in understanding the dispersion of the data and identifying the values that lie at the 25th, 50th, and 75th percentiles.
How are variance and standard deviation used in descriptive statistics?
-Variance measures the spread of data points around the mean, indicating how much the data varies. Standard deviation is the square root of the variance and provides a measure of the average distance of each data point from the mean.
What is a pie chart used for in descriptive statistics?
-A pie chart is used to represent categorical data in a circular chart divided into slices, where each slice represents a category's proportion of the whole.
How can you create a pie chart from a dataset?
-To create a pie chart, first, determine the percentage each category represents of the total data. Then, draw a circle and divide it into slices where the size of each slice corresponds to the percentage of its category.
What is the significance of a high standard deviation in a dataset?
-A high standard deviation indicates that the data points are widely spread out from the mean, suggesting greater variability within the dataset.
Outlines

This section is available to paid users only. Please upgrade to access this part.
Upgrade NowMindmap

This section is available to paid users only. Please upgrade to access this part.
Upgrade NowKeywords

This section is available to paid users only. Please upgrade to access this part.
Upgrade NowHighlights

This section is available to paid users only. Please upgrade to access this part.
Upgrade NowTranscripts

This section is available to paid users only. Please upgrade to access this part.
Upgrade Now

5.0 / 5 (0 votes)