What is a Sampling Distribution? | Puppet Master of Statistics
Summary
TLDRIn this video, Mike Marin explains the concept of a sampling distribution of the mean, a fundamental idea in statistics. He uses a fun analogy involving fish in a lake to demonstrate how a random sample can estimate a population mean. The video discusses how sample means vary due to sampling variability and introduces key concepts like standard error and the normal distribution of sample means. Mike emphasizes the importance of understanding these principles for statistical inference, even when the true population values are unknown. Ultimately, this knowledge helps statisticians make accurate predictions and decisions based on limited data.
Takeaways
- 😀 A sampling distribution is the probability distribution of a given statistic, helping us understand how different sample means can vary from the population mean.
- 😀 The concept of a sampling distribution helps statisticians estimate the population mean using just one random sample, even though the true mean is unknown.
- 😀 The population mean and standard deviation are crucial for understanding how random samples behave in a given population, as shown by the example of fish lengths in a lake.
- 😀 A sample mean is just one of many possible estimates we could get from different random samples, and it will likely differ from the population mean due to sampling variability.
- 😀 Sampling distributions describe all the possible sample means we could get from repeated sampling, and this variability forms the basis of statistical inference.
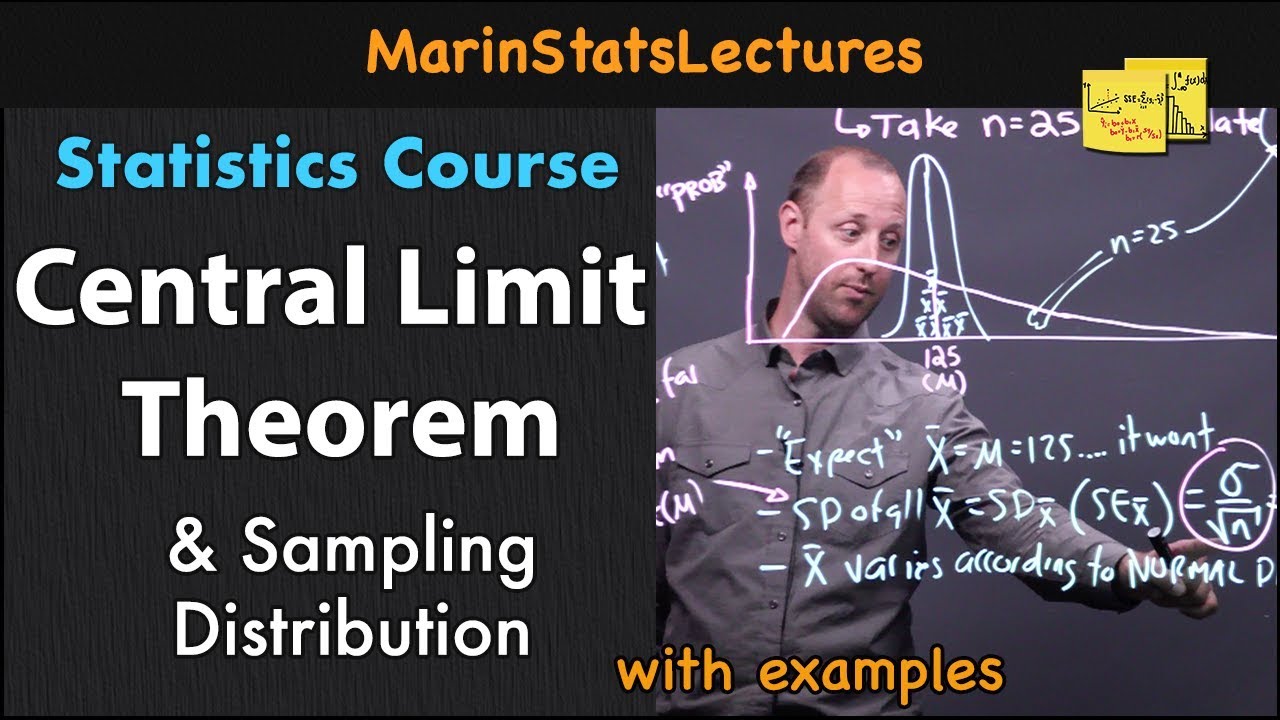
- 😀 The standard error quantifies how much a sample mean typically deviates from the true population mean. For example, with a sample of 25 fish, the standard error is 2 cm.
- 😀 Even without knowing the true population values, statisticians can estimate how close their sample mean is to the true mean using probability theory and standard error.
- 😀 The sampling distribution of the mean tends to follow a normal distribution (bell-shaped curve) as long as the sample size is large enough, even if the population distribution is not normal.
- 😀 The empirical rule suggests that about 95% of sample means will fall within two standard errors of the population mean, providing a range of likely values for the true mean.
- 😀 The video emphasizes that understanding sampling distributions is essential for making valid inferences about populations, especially when the true values are unknown.
- 😀 Statistical inference techniques, such as constructing confidence intervals and hypothesis testing, rely on an understanding of sampling distributions to make reliable statements about populations.
Q & A
What is the concept of a sampling distribution of the mean?
-A sampling distribution of the mean is the probability distribution of a given statistic, based on a random sample. It describes the possible outcomes of sample means from repeated random sampling and helps us understand how sample estimates relate to the true population mean.
Why is it important to understand the sampling distribution?
-Understanding the sampling distribution is crucial because it allows us to make informed decisions about the precision of sample estimates, helps in making statistical inferences, and provides a framework for constructing confidence intervals and hypothesis testing.
How does sampling variability affect the sample mean?
-Sampling variability means that the sample mean will differ each time we collect a new sample because different random samples are taken. This variability is inherent due to the randomness of sampling and is an important factor when estimating the true population mean.
What is the standard error, and how is it calculated?
-The standard error is the standard deviation of the sampling distribution of the mean. It quantifies how much the sample means deviate from the true population mean. It is calculated by dividing the population standard deviation by the square root of the sample size.
How does the sample size affect the standard error?
-As the sample size increases, the standard error decreases. This means that larger samples tend to give more precise estimates of the population mean because the sample means are less likely to deviate from the true mean.
What role does probability theory play in understanding sampling distributions?
-Probability theory helps us predict and quantify the behavior of sample means. By understanding how samples behave based on probability, we can make informed decisions and estimations even when we only have a random sample instead of the full population.
What does the term 'parameter' refer to in the video?
-A parameter refers to a value that describes a characteristic of the entire population. In this case, the population mean length of the fish in the lake is a parameter, and the goal is to estimate it using random samples.
What is the shape of the sampling distribution of the mean?
-The sampling distribution of the mean is approximately normal or bell-shaped, especially as the sample size grows. This holds true even if the underlying population is not normally distributed, as long as the sample size is large enough.
What does the rule of thumb about the sample means tell us?
-The rule of thumb suggests that approximately 95% of sample means will fall within two standard errors of the true population mean. This means that most sample means will be within a small range of the true mean.
Why is it important to understand the behavior of sample means when we know the true population values?
-Understanding how sample means behave when the true population values are known helps build the foundation for statistical inference. It allows statisticians to make reliable statements about a population, even when only a sample is available, by applying probability theory and the concept of sampling distributions.
Outlines

Этот раздел доступен только подписчикам платных тарифов. Пожалуйста, перейдите на платный тариф для доступа.
Перейти на платный тарифMindmap

Этот раздел доступен только подписчикам платных тарифов. Пожалуйста, перейдите на платный тариф для доступа.
Перейти на платный тарифKeywords

Этот раздел доступен только подписчикам платных тарифов. Пожалуйста, перейдите на платный тариф для доступа.
Перейти на платный тарифHighlights

Этот раздел доступен только подписчикам платных тарифов. Пожалуйста, перейдите на платный тариф для доступа.
Перейти на платный тарифTranscripts

Этот раздел доступен только подписчикам платных тарифов. Пожалуйста, перейдите на платный тариф для доступа.
Перейти на платный тарифПосмотреть больше похожих видео

Probabilitas dan Statistik: 8.6 Central Limit Theorem
Sampling Distributions: Introduction to the Concept
Central Limit Theorem & Sampling Distribution Concepts | Statistics Tutorial | MarinStatsLectures
Statistics for Psychology

Sampling Distributions (7.2)
Samples from a Normal Distribution | Statistics Tutorial #4 | MarinStatsLectures
5.0 / 5 (0 votes)
