STATISTIKA CARA MENCARI NILAI MEAN, MEDIAN, MODUS DATA KELOMPOK PART 1
Summary
TLDRIn this educational tutorial, the presenter explains fundamental statistical concepts such as mean, median, mode, and how to calculate them for grouped data. Using practical examples like the weight of 60 people in a village and the length of fish, the video provides step-by-step guidance on how to compute the mean, locate the median, and determine the mode using frequency tables. The video also highlights key formulas, making complex statistical concepts easier to understand for viewers. The presenter encourages viewers to subscribe and engage for further updates and support on similar topics.
Takeaways
- 😀 The video covers topics in statistics, including measures of central tendency such as mean, median, mode, quartiles, deciles, and percentiles.
- 😀 The video encourages viewers to subscribe and activate notifications for updates from the channel.
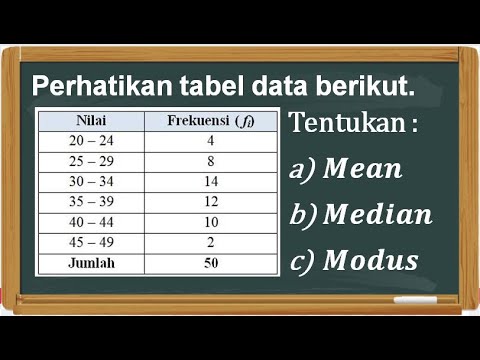
- 😀 The presenter explains how to calculate the mean for grouped data using a frequency table, emphasizing the need to find the midpoint for each class interval.
- 😀 The formula for calculating the mean is provided: Sum of (frequency × midpoint) divided by total frequency.
- 😀 For the given example, the mean is calculated to be approximately 70.57 after applying the appropriate formula.
- 😀 The video also discusses how to find the median for grouped data, using a frequency table and cumulative frequency.
- 😀 To find the median, the presenter calculates the cumulative frequency and identifies the median class based on the total frequency.
- 😀 The formula for the median is provided, involving the lower boundary of the median class and the class width.
- 😀 The presenter calculates the median for the example data as 46.20, rounding the result as needed.
- 😀 For the mode, the presenter explains how to calculate it using the formula involving the class with the highest frequency, as well as the differences between frequencies of adjacent classes.
- 😀 The mode for the example is calculated to be 20.5 using the provided formula and class frequencies.
Q & A
What is the purpose of adding the 'exe' column in the frequency distribution table?
-The 'exe' column represents the midpoint of each class interval, calculated by finding the average of the lower and upper bounds of each class. This value is essential for calculating the mean in a grouped frequency distribution.
How is the mean of grouped data calculated in this video?
-The mean of grouped data is calculated by multiplying the frequency of each class by its midpoint ('exe'), summing these products, and then dividing by the total frequency. In the example, the mean is calculated as 4210 divided by 60, resulting in 70.5.
Why is the median calculated by finding the cumulative frequency?
-The median represents the middle value of the data, and finding the cumulative frequency helps determine the class interval where the median lies. By identifying this interval, we can apply the median formula to estimate the value.
How do you determine the class interval where the median lies?
-To find the median class, calculate half of the total frequency. For example, if the total frequency is 40, the median will be at position 20. By adding the frequencies cumulatively (5+9=14, then 14+8=22), we determine that the median class is the third class.
What formula is used to calculate the median from the cumulative frequency?
-The median is calculated using the formula: Median = L + [(N/2 - F) / f] * h, where L is the lower bound of the median class, N is the total frequency, F is the cumulative frequency before the median class, f is the frequency of the median class, and h is the class width.
In the mode calculation, what does 'D1' and 'D2' represent?
-'D1' is the difference between the frequency of the modal class and the frequency of the class before it, while 'D2' is the difference between the frequency of the modal class and the frequency of the class after it. These differences help in finding the mode using the mode formula.
What is the formula used to calculate the mode in the given example?
-The formula for the mode is: Mode = L + [(D1) / (D1 + D2)] * h, where L is the lower boundary of the modal class, D1 is the frequency difference between the modal class and the previous class, D2 is the frequency difference between the modal class and the next class, and h is the class width.
What class interval is identified as the mode in the example, and why?
-The third class (19-24) is identified as the modal class because it has the highest frequency (10), making it the most frequent class in the given data.
How is the class width (h) calculated for the mode formula?
-The class width (h) is calculated as the difference between the upper boundary and the lower boundary of a class interval. For example, in the mode calculation, the width of the third class is 24 - 19 + 1 = 6.
What is the final mode value calculated in the example, and how is it derived?
-The final mode value is 20.5, calculated by plugging the values into the mode formula: Mode = 18.5 + [(4 / 12) * 6] = 20.5.
Outlines

Этот раздел доступен только подписчикам платных тарифов. Пожалуйста, перейдите на платный тариф для доступа.
Перейти на платный тарифMindmap

Этот раздел доступен только подписчикам платных тарифов. Пожалуйста, перейдите на платный тариф для доступа.
Перейти на платный тарифKeywords

Этот раздел доступен только подписчикам платных тарифов. Пожалуйста, перейдите на платный тариф для доступа.
Перейти на платный тарифHighlights

Этот раздел доступен только подписчикам платных тарифов. Пожалуйста, перейдите на платный тариф для доступа.
Перейти на платный тарифTranscripts

Этот раздел доступен только подписчикам платных тарифов. Пожалуйста, перейдите на платный тариф для доступа.
Перейти на платный тарифПосмотреть больше похожих видео

Statistika Dasar Ukuran Pemusatan Data (Mean, Modus, Median) Data Tunggal dan Data Kelompok

UKURAN PEMUSATAN DATA BERKELOMPOK | Rataan Median Modus Kuartil Desil Persentil
Menentukan Mean, Median, dan Modus Data Kelompok
Statistika #3 Ukuran Pemusatan : Mean - Modus - Median | Kelas X Fase E Kurikulum Merdeka
Ukuran pemusatan data, mean median modus, Statistika
Statistika - Ukuran Pemusatan Data (Mean, Median, Modus)
5.0 / 5 (0 votes)
