dispersion
Summary
TLDRIn this educational video, various measures of dispersion are discussed to help analyze data variation. The video explains concepts like range, quartile deviation, mean deviation, and standard deviation, with practical examples from manufacturing processes. Key terms like population vs. sample standard deviation, and coefficient of variation are also covered. The focus is on how these measures help in understanding the spread of data, identifying inconsistencies, and making more informed decisions based on statistical analysis. The tutorial also includes step-by-step instructions for calculating each measure using real-world data sets.
Takeaways
- 😀 Measures of dispersion help us understand how much data varies from the mean, median, and mode.
- 😀 The **range** is the difference between the maximum and minimum values in a dataset.
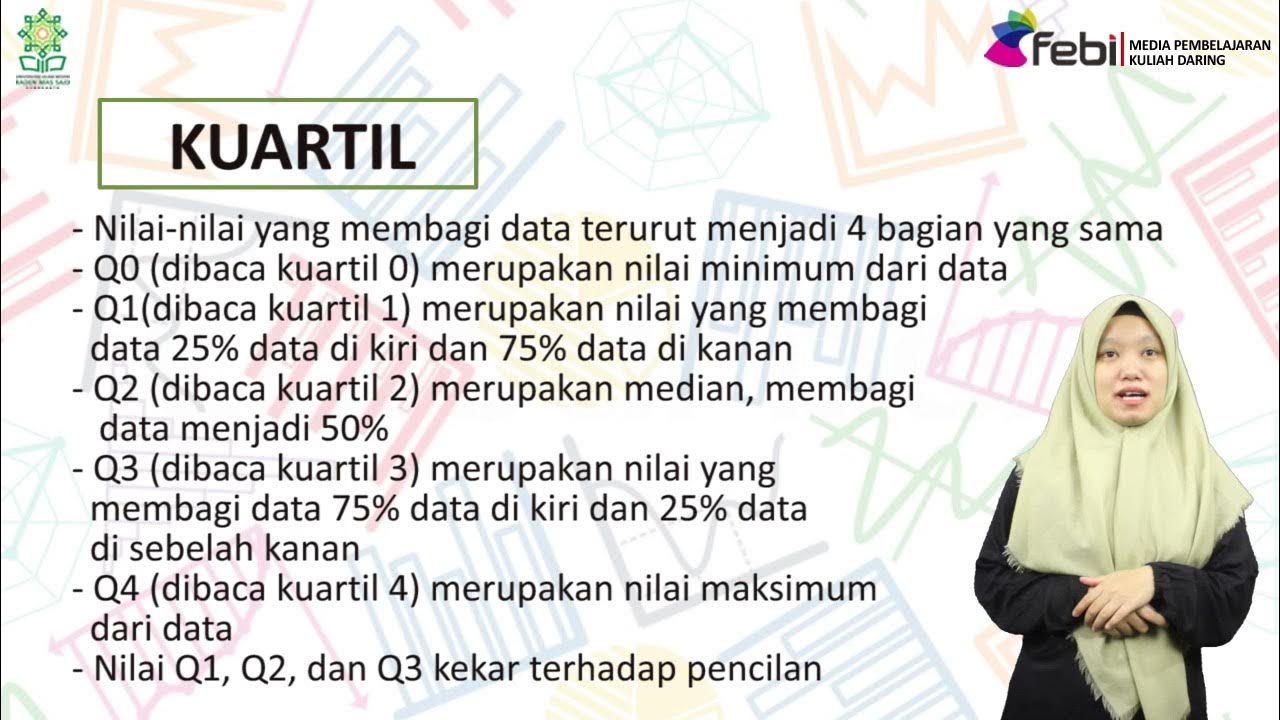
- 😀 **Quartile Deviation** measures the spread of 50% of the data, using Q1 (25th percentile) and Q3 (75th percentile).
- 😀 **Mean Deviation** calculates the average of absolute deviations from the mean, showing how much data points deviate from the mean.
- 😀 **Standard Deviation** is the most common measure of dispersion, showing how data points vary from the mean. A larger standard deviation means greater variability.
- 😀 The calculation for standard deviation involves subtracting the mean from each data point, squaring the differences, summing them, dividing by the number of data points, and then taking the square root.
- 😀 **Population** standard deviation is used for large datasets, while **sample** standard deviation is used for subsets of data.
- 😀 For **grouped data**, you multiply each value by its frequency, subtract the mean, square the result, and then sum them up before calculating the standard deviation.
- 😀 **Combined Standard Deviation** is used when combining two or more datasets, using specific formulas to account for the number of observations and means.
- 😀 The **Coefficient of Variation (CV)** is a standardized measure of dispersion, calculated by dividing the standard deviation by the mean and multiplying by 100, helping compare relative variability across datasets.
Q & A
What is the main purpose of studying dispersion in data?
-Dispersion helps us understand how much data varies from the mean, median, or mode. It is crucial for comparing multiple datasets to assess their variability and to improve processes like quality control in manufacturing.
How is the range of a dataset calculated?
-The range is calculated by subtracting the minimum value from the maximum value in the dataset. Formula: Range = Maximum Value - Minimum Value.
What is the difference between Q1 and Q3 in quartile deviation?
-Q1 is the first quartile (the 25th percentile), and Q3 is the third quartile (the 75th percentile). The quartile deviation (QD) measures the spread of the middle 50% of the data and is calculated as Q3 - Q1.
How do you calculate the mean deviation of a dataset?
-To calculate the mean deviation, first find the mean of the dataset. Then subtract the mean from each data point, take the absolute value of each difference, and calculate the average of those absolute deviations.
What is the significance of standard deviation in statistics?
-Standard deviation is a measure of how spread out the data points are from the mean. A low standard deviation indicates that the data points are close to the mean, while a high standard deviation indicates more variability.
What is the formula for calculating standard deviation?
-The formula for calculating standard deviation is: σ = √(Σ(Xi - μ)² / N), where Xi is each data point, μ is the mean, and N is the number of data points.
What is the difference between population standard deviation and sample standard deviation?
-The population standard deviation is used when the entire data set is available, while the sample standard deviation is used when only a subset (sample) of the data is available. For the sample, the denominator is N-1 (degrees of freedom) instead of N.
How is variance related to standard deviation?
-Variance is the square of the standard deviation. It measures the degree of spread in the data, but standard deviation is preferred for interpretation because it is in the same units as the data.
What is combined standard deviation, and when is it used?
-Combined standard deviation is used when merging two or more data sets. It is calculated by considering the standard deviation, means, and sizes of the individual datasets to get an overall measure of spread.
How is the coefficient of variation (CV) calculated, and why is it useful?
-The coefficient of variation (CV) is calculated by dividing the standard deviation by the mean and multiplying by 100. It is useful for comparing the relative variability between different datasets, especially when the datasets have different units or scales.
Outlines

Этот раздел доступен только подписчикам платных тарифов. Пожалуйста, перейдите на платный тариф для доступа.
Перейти на платный тарифMindmap

Этот раздел доступен только подписчикам платных тарифов. Пожалуйста, перейдите на платный тариф для доступа.
Перейти на платный тарифKeywords

Этот раздел доступен только подписчикам платных тарифов. Пожалуйста, перейдите на платный тариф для доступа.
Перейти на платный тарифHighlights

Этот раздел доступен только подписчикам платных тарифов. Пожалуйста, перейдите на платный тариф для доступа.
Перейти на платный тарифTranscripts

Этот раздел доступен только подписчикам платных тарифов. Пожалуйста, перейдите на платный тариф для доступа.
Перейти на платный тарифПосмотреть больше похожих видео

Ukuran Dispersi dan Variasi

Statistics 101: Exploring measures of dispersion

Dispersi Relatif [STATISTIK 1]

Mathematics in the Modern World - Data Management (Part 1)

ESTADISTICA DESCRIPTIVA.- PARAMETROS DE CENTRALIZACION Y DISPERSION.

Statistika Deskriptif Ukuran Pemusatan dan Penyebaran Data | Zulfanita Dien Rizqiana, S.Stat., M.Si.
5.0 / 5 (0 votes)
