FREQUENCY DISTRIBUTION: How to do it? Vid#5 FREE Tutorial Statistical Analysis | EASILY EXPLAINED!
Summary
TLDRThis tutorial covers the process of creating both categorical and grouped frequency distribution tables in statistics. It walks through steps such as organizing data, determining the number of classes using the '2 to the K' rule, calculating class intervals, and obtaining class boundaries. The video also explains how to compute relative frequencies, percentages, cumulative frequencies, and midpoints, emphasizing the importance of accuracy. The tutorial concludes with an example and a preview of the next lesson, which will focus on stem-and-leaf plots and statistical graphs.
Takeaways
- 📊 First, arrange the data in ascending or descending order to make tallying easier.
- 📏 Step two involves determining the number of classes by finding the range, which is the difference between the highest and lowest values.
- 🧮 Use the 2 to the K rule to determine the smallest number of classes (K) such that 2 raised to K is greater than the number of observations.
- 📋 There are two types of frequency distributions: categorical frequency distribution (for nominal or ordinal data) and grouped frequency distribution (for large ranges of data).
- 📑 The categorical frequency distribution requires creating a table with class, tally, frequency, and percentage labels.
- 🔢 In grouped frequency distribution, data is grouped into classes with equal intervals to manage large data sets.
- 📐 The class interval (or width) is calculated by dividing the range by the number of classes, rounding up to cover all data points.
- 🧾 Set class limits by adding the interval to the starting point (smallest data value) and repeat until all classes are defined.
- ⚖️ Calculate the relative frequency by dividing the frequency of each class by the total frequency, then convert it to a percentage.
- 🔄 Cumulative frequency is determined by adding the frequency of each class to the total of preceding classes, and midpoints are calculated by averaging the lower and upper class limits.
Q & A
What is the first step in constructing a frequency distribution table?
-The first step is to arrange the data in order, either in ascending or descending order. This makes it easier to tally the data later.
How do you determine the number of classes in a frequency distribution?
-The number of classes is determined using the 2 to the K rule. The goal is to find the smallest K such that 2 raised to the power of K is greater than the number of observations.
What is the range in a frequency distribution and how is it calculated?
-The range is the difference between the highest and lowest values in the data set. It is calculated by subtracting the lowest value from the highest value.
What is the difference between a categorical frequency distribution and a grouped frequency distribution?
-A categorical frequency distribution is used to organize nominal or ordinal data, while a grouped frequency distribution is used when the range of the data is large, grouping the data into intervals or classes.
What is the process of constructing a categorical frequency distribution?
-The process involves four steps: 1) creating a table with labels like class, tally, frequency, and percentage, 2) tallying the raw data, 3) converting the tallied data into numerical frequencies, and 4) calculating the percentages.
When is a grouped frequency distribution used?
-A grouped frequency distribution is used when the range of the data set is large, and the data needs to be grouped into classes.
How do you calculate the class interval (width) in a grouped frequency distribution?
-The class interval is calculated by dividing the range by the number of classes. The result is often rounded up to ensure all data points are covered.
Why is it important to round up the class interval rather than rounding down?
-Rounding up ensures that all decimal points are covered and helps avoid statistical bias by including the full range of data.
What are class boundaries and how are they determined?
-Class boundaries are the limits of each class in a frequency distribution. They are determined by subtracting 0.5 from the lower limit and adding 0.5 to the upper limit of each class.
How do you compute relative frequency in a frequency distribution?
-Relative frequency is computed by dividing the frequency of each class by the total frequency of all classes.
What is cumulative frequency and how is it calculated?
-Cumulative frequency is the sum of the frequencies for a class and all preceding classes. It is calculated by adding the frequency of each class to the cumulative total of the previous classes.
Outlines

Этот раздел доступен только подписчикам платных тарифов. Пожалуйста, перейдите на платный тариф для доступа.
Перейти на платный тарифMindmap

Этот раздел доступен только подписчикам платных тарифов. Пожалуйста, перейдите на платный тариф для доступа.
Перейти на платный тарифKeywords

Этот раздел доступен только подписчикам платных тарифов. Пожалуйста, перейдите на платный тариф для доступа.
Перейти на платный тарифHighlights

Этот раздел доступен только подписчикам платных тарифов. Пожалуйста, перейдите на платный тариф для доступа.
Перейти на платный тарифTranscripts

Этот раздел доступен только подписчикам платных тарифов. Пожалуйста, перейдите на платный тариф для доступа.
Перейти на платный тарифПосмотреть больше похожих видео
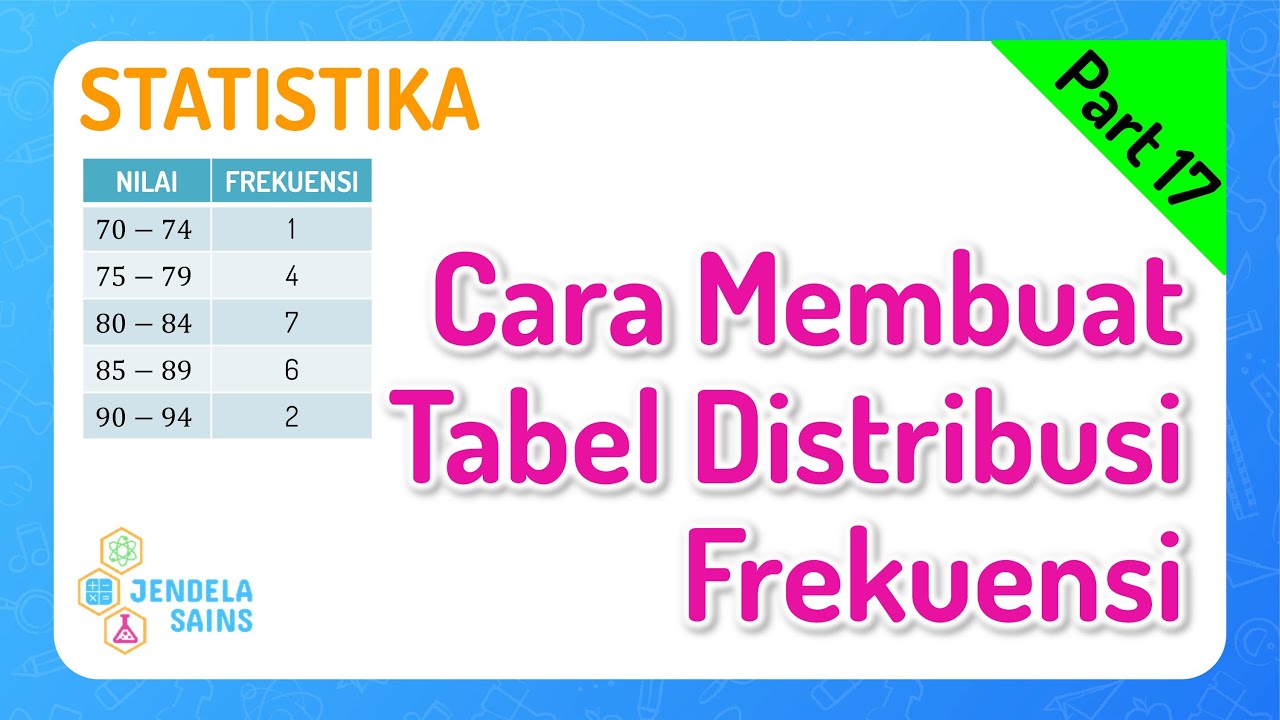
Statistika • Part 17: Cara Membuat Tabel Distribusi Frekuensi

CARA PENYAJIAN DATA KELOMPOK - MATEMATIKA SMA
DISTRIBUSI FREKUENSI - STATISTIK DESKRIPTIF | BAB 2
Statistika Deskriptif (Bag 1): Cara Membuat dan Membaca OGIVE

Menggunakan Data [Part 2] - Mengorganisasikan Data

FREQUENCY DISTRIBUTION: Common Terminologies Vid#4 FREE Tutorial | Statistics | EASILY EXPLAINED!
5.0 / 5 (0 votes)
