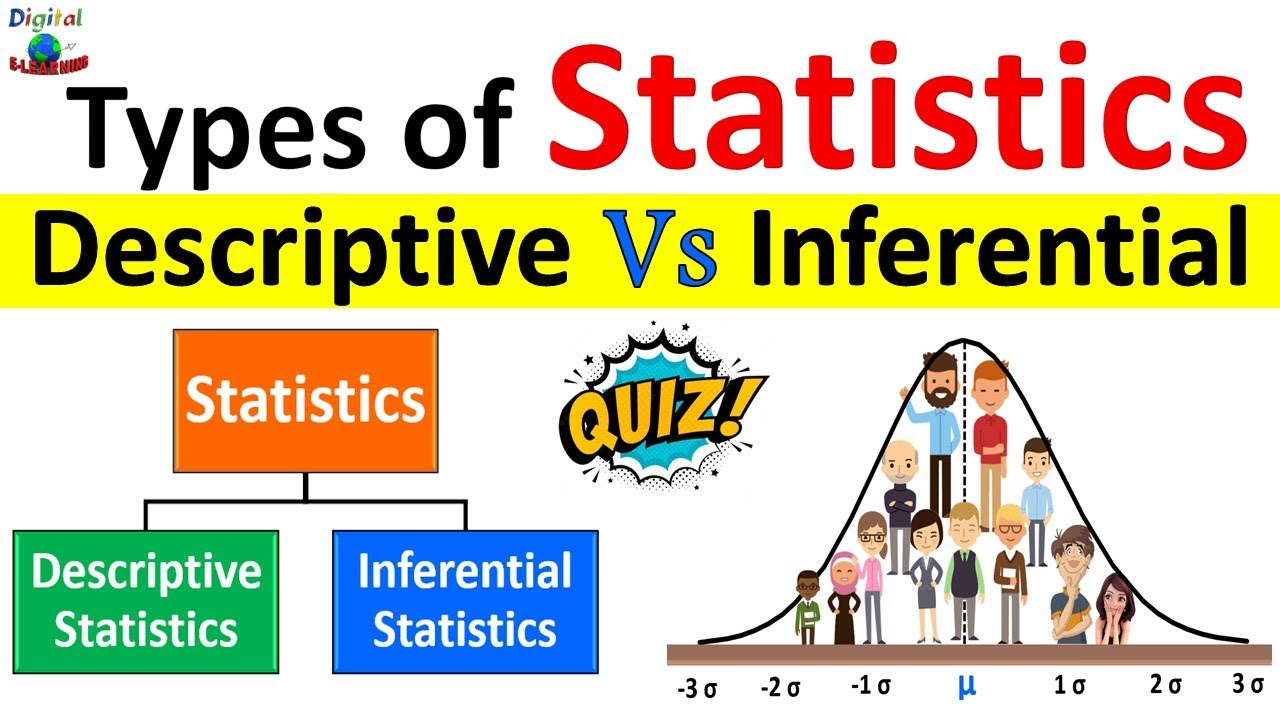
Measures of Variability (Range, Standard Deviation, Variance)

Daniel Storage
18 Jun 201909:29

Summary

TLDRThis video script delves into measures of variability, a crucial aspect of descriptive statistics that complements measures of central tendency. It emphasizes the importance of understanding data spread and consistency, using examples like clustered and spread-out datasets, and the choice between two medications with different improvement variabilities. The script introduces the range as a simple measure of variability, highlighting its limitations and the need for more nuanced metrics like standard deviation and variance. These measures provide deeper insights into data distribution, especially in normally distributed datasets, where they can predict the percentage of data points within certain intervals from the mean.

Takeaways

  • 📊 Measures of variability are essential in descriptive statistics to understand the dispersion of data, in addition to measures of central tendency like the mean.
  • 🌟 Two datasets can have the same mean but different variability, which is crucial for understanding the data's distribution.
  • 💊 Variability is important in real-life decisions, such as choosing between medications with similar effectiveness but different consistency.
  • 🔢 The range is a simple measure of variability calculated as the difference between the highest and lowest values in a dataset.
  • 🚫 A limitation of the range is that it might not fully represent the dataset, especially if there are outliers or if the data is not evenly distributed.
  • 📉 Standard deviation is a measure that describes the typical amount by which data points deviate from the mean and is more informative than the range.
  • 📚 The standard deviation is particularly useful in understanding normally distributed data, such as height and weight, providing insights into what is common and uncommon.
  • 📊 One standard deviation from the mean covers approximately 68% of the data in a normal distribution, two standard deviations cover about 95%, and three cover around 99.7%.
  • 🧮 Variance is calculated as the square of the standard deviation and represents the average squared deviation from the mean.
  • 📘 The formulas for standard deviation and variance differ for population and sample data, with the population version using the Greek letter Sigma (σ) and the sample version using 's'.

Q & A

  • Why are measures of variability important in statistics?

    -Measures of variability are important because they provide a way to quantify the differences in a dataset, which cannot be captured by measures of central tendency alone, such as the mean. They describe how scores in a dataset differ from one another and can indicate how spread out or clustered the data points are.

  • What is the difference between the datasets with a mean of 87 in the video example?

    -In the video, the top dataset has scores that are very clustered together, indicating low variability, while the bottom dataset has scores that are spread out, indicating high variability. Despite both having the same mean, the distribution of scores is quite different, highlighting the need for measures of variability.

  • Why might someone choose medication B over medication A in the pharmaceutical example?

    -In the pharmaceutical example, even though the mean improvement scores for medications A and B are the same, medication B is chosen because it shows less variability in improvement. This suggests that medication B provides a more consistent effect across patients, which is often a desirable quality in medical treatments.

  • What is the range and how is it calculated?

    -The range is a simple measure of variability that represents the difference between the highest and lowest values in a dataset. It is calculated by subtracting the lowest value (L) from the highest value (H), as shown by the formula R = H - L.

  • What is the limitation of using the range as a measure of variability?

    -The limitation of the range is that it only considers the highest and lowest values in a dataset, potentially missing out on other important information about the distribution of the data. It does not account for the distribution of scores in between the extremes.

  • What is standard deviation and why is it useful?

    -Standard deviation is a measure of variability that describes the typical amount by which scores deviate from the mean. It is useful because it provides a more comprehensive view of the dataset's dispersion than the range. It is particularly informative in normally distributed data, where it can indicate the proportion of data points within certain intervals from the mean.

  • What does it mean for a dataset to be normally distributed?

    -A dataset is normally distributed if it follows a specific bell-shaped curve, often referred to as the normal curve. This distribution is characterized by the mean, median, and mode being the same, and the data points symmetrically distributed around the mean.

  • How do standard deviations relate to the normal distribution?

    -In a normally distributed dataset, standard deviations provide insights into the commonality of data points. For instance, about 68% of data points fall within one standard deviation of the mean, 95% within two standard deviations, and 99.7% within three standard deviations.

  • What is variance and how is it different from standard deviation?

    -Variance is the average squared deviation from the mean. It is calculated as the square of the standard deviation. Unlike standard deviation, which is in the same units as the data, variance is in squared units, making it less intuitive but useful for certain statistical calculations.

  • What are the formulas for calculating standard deviation and variance in a population?

    -The formula for population standard deviation is Σ(x - μ)^2 / N, where Σ represents the sum, x is each value in the dataset, μ is the mean, and N is the number of observations. The formula for population variance is Σ(x - μ)^2 / N, which is the same as standard deviation but used to describe the spread of the data in squared units.

  • What are the differences between population and sample standard deviation formulas?

    -The population standard deviation formula divides by the total number of observations (N), while the sample standard deviation formula divides by the number of observations minus one (N-1). This difference accounts for the additional uncertainty introduced by estimating from a sample rather than the entire population.

Outlines

00:00

📊 Introduction to Measures of Variability

This paragraph introduces the concept of measures of variability in descriptive statistics, emphasizing their importance alongside measures of central tendency. The speaker uses two datasets with the same mean to demonstrate how variability can significantly differ between datasets, thus affecting the interpretation of data. The top dataset shows scores clustered closely together, while the bottom dataset shows scores spread out widely. The speaker also discusses a real-life scenario involving the selection of medications for depression, where the variability in effectiveness is a crucial factor in decision-making. The paragraph concludes by introducing three measures of variability: range, standard deviation, and variance, with the range being the simplest to calculate.

05:02

🔍 Exploring Standard Deviation and Variance

The second paragraph delves into the significance of standard deviation, which quantifies the average amount by which data points deviate from the mean. The speaker explains that standard deviations are particularly useful for understanding normally distributed data, such as height and weight. It is highlighted that standard deviations can indicate what is common and uncommon within a dataset. For instance, in a normal distribution, approximately 68% of data points fall within one standard deviation of the mean, and 99.7% fall within three standard deviations. The speaker uses IQ scores as an example to illustrate how knowing the mean and standard deviation can provide insights into the distribution of intelligence. The paragraph also introduces the concept of variance, which is the square of the standard deviation, representing the average squared deviation from the mean. The speaker mentions that formulas for calculating standard deviation and variance will be covered in subsequent videos.

Mindmap

Keywords

💡Measures of Variability

Measures of variability are statistical tools used to quantify the spread or dispersion of a dataset. They are crucial for understanding the distribution of data points around the mean. In the video, the speaker emphasizes the importance of these measures by contrasting datasets with the same mean but different levels of variability, illustrating how knowing only the mean can be misleading. Measures of variability help in making informed decisions, such as choosing between medications with different improvement patterns.

💡Descriptive Statistics

Descriptive statistics are used to summarize and organize data in a meaningful way. They include measures of central tendency (like mean, median, mode) and measures of variability. The video script discusses how measures of variability complement measures of central tendency by providing a fuller picture of the dataset's characteristics.

💡Mean

The mean, or average, is a measure of central tendency that represents the arithmetic average of a dataset. The script uses the mean to introduce the concept of variability, pointing out that a single mean value does not capture the full story of a dataset, especially when comparing datasets with different spreads.

💡Range

The range is a simple measure of variability that calculates the difference between the highest and lowest values in a dataset. It provides a quick snapshot of the spread of the data. The video uses the range to show how different datasets can have the same mean but vastly different spreads, thus highlighting the need for more nuanced measures of variability.

💡Standard Deviation

Standard deviation is a measure of variability that indicates the average distance of data points from the mean. It is more sensitive to the distribution of all data points compared to the range. The video explains that standard deviation is particularly useful in normally distributed data, as it can describe the likelihood of data points occurring within certain intervals from the mean.

💡Variance

Variance is the average of the squared differences from the mean. It is the square of the standard deviation and measures the spread of a set of numbers. The video mentions variance as a fundamental concept in understanding the variability within a dataset, although it does not have its own unique symbol and is often represented as the square of the standard deviation.

💡Population Standard Deviation

Population standard deviation is the standard deviation calculated from an entire population. It is denoted by the symbol Sigma (Σ). The video script introduces this term to differentiate it from sample standard deviation, emphasizing the importance of knowing whether the data represents a population or a sample.

💡Sample Standard Deviation

Sample standard deviation is the standard deviation calculated from a sample of a population. It is denoted by the symbol 's'. The video script explains that when working with a sample, this measure is used to estimate the variability within the entire population.

💡Sums of Squares (SS)

Sums of squares refer to the sum of the squared differences between each data point and the mean. It is a component in the formulas for calculating variance and standard deviation. The video script mentions that the numerator in the formulas for both population and sample variance and standard deviation is the sums of squares, indicating its role in quantifying variability.

💡Normal Distribution

Normal distribution, also known as the Gaussian distribution, is a continuous probability distribution where data points are symmetrically distributed around the mean. The video uses the example of IQ scores to illustrate how standard deviations can provide insights into the distribution of data in a normal curve, such as the percentage of data points falling within one, two, or three standard deviations from the mean.

Highlights

Measures of variability are essential for understanding data beyond central tendency.

Datasets with the same mean can have vastly different distributions, necessitating measures of variability.

The range is a simple measure of variability that calculates the difference between the highest and lowest values in a dataset.

The range can be quickly calculated but may not fully represent the dataset's variability due to outliers.

Standard deviation quantifies the average amount of variation from the mean, providing a more nuanced view of data spread.

Variance is the square of standard deviation, representing the average squared deviation from the mean.

In a normal distribution, standard deviations help to identify what is common and uncommon within a dataset.

68% of data points fall within one standard deviation from the mean in a normal distribution.

95% of data points are within two standard deviations of the mean, indicating a high level of confidence in the data's central tendency.

99.7% of data points lie within three standard deviations from the mean, which is considered extremely rare territory.

Standard deviations provide a framework for understanding the rarity or commonality of data points, such as IQ scores.

Knowing the standard deviation of a dataset can help in making informed decisions, such as choosing between medications with different variability profiles.

The video will cover the calculation of standard deviation and variance in upcoming lessons, providing tools for deeper data analysis.

Population standard deviation is denoted by the symbol Sigma (Σ), while sample standard deviation is denoted by 's'.

Population variance is represented as Sigma squared (Σ²), and sample variance as 's²', indicating the average squared deviation from the mean.

The sums of squares (SS) is a key component in the formulas for calculating standard deviation and variance, to be explained in more detail in future videos.

Transcripts

play00:00

in this video we're going to learn about

play00:01

measures of variability another form of

play00:04

descriptive statistics that people often

play00:06

want to know in addition to measures of

play00:08

central tendency but before we get to

play00:10

any of the nitty-gritty details I wanted

play00:12

to kind of motivate why we need measures

play00:14

of variability with two examples so

play00:17

here's two different datasets one on the

play00:19

top and one on the bottom I'll just go

play00:21

ahead and tell you that the mean for

play00:22

both datasets is 87 now if I were to

play00:26

just tell you the mean of these data I

play00:28

would be misleading you a little bit

play00:29

because in reality the situation in each

play00:32

dataset is quite different if I were to

play00:34

plot it out for example you would see

play00:36

this difference clearly in the top

play00:38

dataset all the scores are very

play00:39

clustered together everything is close

play00:41

but in the bottom dataset scores are

play00:43

very spread out so again I need some way

play00:46

to quantify these differences and a

play00:48

measure of central tendency like the

play00:50

mean simply can't capture that alone

play00:52

here's another example let's say you're

play00:54

working for a pharmaceutical company

play00:57

something like that and you need to

play00:58

decide between two different medications

play01:00

for depression we'll call them

play01:02

medication a and medication B so let's

play01:06

say you did a study where you measured

play01:08

how much improvement happened when

play01:10

people took one over the other and this

play01:12

is what you got so let's say over here

play01:14

that higher scores mean you know more

play01:16

improvement and lower scores mean little

play01:18

to no improvement well let's kind of

play01:20

compare the means in this case are the

play01:22

same in both cases people improved by

play01:25

about 10-ish points or so but the

play01:27

variability is very different on the

play01:29

left some people benefited very greatly

play01:31

whereas others really didn't benefit at

play01:34

all but on the right everyone benefits a

play01:36

good amount in this case I would

play01:38

personally pick medication B because

play01:40

it's more consistent and so this is an

play01:42

example of why knowing the variability

play01:44

might help us to you know make some

play01:47

real-life decisions so in general and

play01:51

statistics measures of variability are

play01:53

ways to describe these differences

play01:55

statistically they describe how scores

play01:58

in a given data set differ from one

play02:00

another and they capture things like how

play02:02

spread out or how clustered together the

play02:04

points are things we've been looking at

play02:06

already so there are three that we're

play02:08

going to talk about we have the range

play02:10

standard deviation and variance let's

play02:12

start with the range

play02:14

the range is nice because it's a really

play02:16

simple measure of variability of

play02:18

dispersion of how spread out points are

play02:21

it can often be calculated in five or

play02:24

ten seconds here's the formula so we

play02:26

have the range are don't get confused

play02:29

later on when we learn about

play02:30

correlations which are often also

play02:33

described by our we'll use some

play02:35

different subscripts to make that

play02:36

difference clear when the time comes

play02:38

but for now ranges are and then we have

play02:41

R equals H minus L H means the highest

play02:45

score in the data set L means the lowest

play02:47

score in the data set so you can see

play02:49

that this is a very simple calculation

play02:50

and if we go back to the example we were

play02:53

working with a minute ago we can

play02:55

calculate the range very quickly so for

play02:57

the first data set we have 95 minus 80

play03:00

so the range is 15 and in the second

play03:02

data set we have a hundred and fifty

play03:04

minus 25 giving us a much larger range

play03:06

of a hundred and twenty-five so in this

play03:09

case I would do well to kind of report

play03:11

both to you I'll tell you the mean and

play03:13

this measure of variability because that

play03:16

gives you a more full picture of what's

play03:17

going on so a mean of 87 and a range of

play03:21

15 describes a very different situation

play03:24

compared to a mean of 87 and a range of

play03:27

125 so again it's great idea for me to

play03:30

report both and this is what's often

play03:31

done a big limitation of the range

play03:35

though is that by using it even though

play03:37

it's simple and it's pretty effective

play03:39

you might miss a little bit of the data

play03:41

a little bit of the information in your

play03:43

data set and let me show you an example

play03:44

to illustrate here's the data set here

play03:47

although these bars are quite high

play03:49

there's really just one sort of value in

play03:52

each bar so we have one person who

play03:54

scored a thirty one person who scored a

play03:56

forty and so on

play03:57

another range here is a 120 it's a

play04:00

hundred fifty minus thirty but let's

play04:03

look at a second data set in this case

play04:05

the range is still one hundred and

play04:07

twenty because our highest and lowest

play04:08

values are the same but everybody's kind

play04:11

of over here and there's just a couple

play04:13

outliers beyond that so again if I were

play04:15

to just tell you the range I might be

play04:17

misleading you a little bit because

play04:18

you're not sure if it looks like this on

play04:20

the left or if the data looks like this

play04:22

on the right and this is where standard

play04:25

deviation and variance come into play

play04:27

standard deviation just like the name

play04:29

suggests describes the standard or

play04:32

typical amount that scores deviate from

play04:35

the mean hence standard deviation now

play04:38

we'll get into exactly what this looks

play04:39

like once we learn to calculate standard

play04:42

deviation but I just want to show you

play04:44

some symbols for now so like with means

play04:47

we have different symbols to describe

play04:49

population standard deviation versus

play04:52

sample standard deviation population

play04:54

standard deviation is described by Sigma

play04:56

this sort of Oh with Elvis hair I like

play04:59

to think of it as not to be confused

play05:01

with this Sigma which is a capital S

play05:04

unfortunately they're named the same

play05:06

thing which means take the sum of we

play05:09

learned about that previously this is

play05:11

Sigma with a little s so for a sample

play05:15

standard deviation is simply described

play05:17

by s so I want to take a step back and

play05:20

talk about why standard deviations are

play05:23

really useful whenever you have a normal

play05:25

curve a normally distributed set of data

play05:28

which is very common in the world things

play05:30

like height weight and so on are all

play05:33

normally distributed standard deviations

play05:35

have this really interesting property of

play05:37

telling you a lot of information about

play05:39

what's common and what's uncommon so if

play05:42

we have zero this is right at the mean

play05:44

of whatever we're talking about right

play05:46

this is the mean 0 standard deviations

play05:48

away from the mean is right here you're

play05:50

right at the mean we can look at one

play05:52

standard deviation above the mean and

play05:53

one standard deviation below and we

play05:55

automatically know just because of how

play05:58

standard deviations work that 68% of

play06:00

people will fall within this range we

play06:03

can go beyond that we know that between

play06:04

two standard deviations in either

play06:06

direction of the mean ninety-five

play06:08

percent of people will be contained and

play06:10

three you're getting really extreme

play06:12

really far out really rare ninety-nine

play06:15

point seven percent of the data will be

play06:17

contained within three standard

play06:18

deviations in either direction from the

play06:20

mean to illustrate this a little bit

play06:23

more let's talk some specifics so let's

play06:25

say I'm looking at IQ scores we know a

play06:27

lot about IQ scores we know for example

play06:30

the population mean of IQ is 100 and we

play06:33

know that the population standard

play06:35

deviation Sigma is 15 so let's go ahead

play06:38

and draw that same sort of normal

play06:40

curve we know that intelligence is

play06:41

normally distributed and let's kind of

play06:44

take a look at what information we have

play06:46

just by knowing standard deviation so

play06:48

average IQ is right here at a hundred

play06:50

one standard deviation above the mean

play06:52

would be 115 two standard deviations

play06:56

above the mean would be 130 and three

play06:59

standard deviations would be a hundred

play07:00

and forty five and we could do the same

play07:02

in the opposite direction one standard

play07:04

deviation below the mean of intelligence

play07:06

is eighty five two standard deviations

play07:09

below is seventy and three standard

play07:11

deviations below the mean of

play07:12

intelligence is fifty five so again I

play07:14

automatically know 68% of people will

play07:18

fall between an IQ of 85 and 115 I also

play07:22

know that ninety-five percent of people

play07:24

will fall between an IQ of 70 and 130

play07:27

and finally that ninety-nine point seven

play07:30

or so will fall between an IQ of 55 and

play07:34

145 so this is great to know because if

play07:37

you tell me you have an IQ of 146 I'm

play07:41

really impressed this is rare this is

play07:43

very extreme but if you tell me you have

play07:46

an IQ of say you know a hundred and six

play07:49

something like that you know that's fine

play07:51

good for you not very impressed right

play07:54

so knowing standard deviations helps you

play07:56

to kind of get this extra information

play07:58

about a data set so finally we have

play08:01

variance variance is very simple it's

play08:05

just the square of standard deviation so

play08:08

it's the average squared deviation from

play08:11

the mean

play08:13

unfortunately for variance it doesn't

play08:15

get its own symbols we just take the

play08:17

symbols we already have for standard

play08:18

deviation and we put a squared because

play08:20

it's just a squared standard deviation

play08:22

so here for a population we would call

play08:24

the variance in a population Sigma

play08:27

squared and for a sample we would call

play08:29

the sample variance s squared so in the

play08:34

next video we'll learn how to calculate

play08:36

some of these things but I want to at

play08:38

least highlight some of the formulas

play08:40

you're going to see so we have four

play08:42

different formulas because we have

play08:43

standard deviation and variance and we

play08:45

have the population versions and the

play08:47

statistic for sample versions so for

play08:50

standard deviation in the population

play08:52

this is our formula

play08:54

notice we have Sigma on the left and we

play08:56

have all this mess which I'll get into

play08:57

next time one thing I'll mention is that

play09:00

for all of these formulas the numerator

play09:02

is called the sums of squares SS and

play09:05

we're gonna learn about what the sums of

play09:07

squares really means in the next video

play09:10

but for now just keep that in mind so

play09:13

for our sample statistic we have this

play09:14

you're gonna see an S on the left here

play09:16

and it's gonna have some similarities

play09:18

but you're gonna notice a difference or

play09:20

two that we'll talk about in the next

play09:21

video

play09:21

for variance we have Sigma squared and

play09:24

for sample statistic version of variance

play09:27

we have s squared

Rate This

5.0 / 5 (0 votes)

Связанные теги
Descriptive StatisticsData AnalysisMeasures of VariabilityStatistical DecisionsData DispersionCentral TendencyRange CalculationStandard DeviationVarianceData Interpretation
Вам нужно краткое изложение на английском?