Types of Data: Nominal, Ordinal, Interval/Ratio - Statistics Help
Summary
TLDRThis script explores the fundamental types of data in statistical analysis: Nominal, Ordinal, and Interval/Ratio. It explains how each type affects the choice of summary statistics and graphical representation, using the example of a questionnaire about choconutties. Nominal data, like chocolate preference, is best shown in pie or bar charts, while ordinal data, such as satisfaction levels, should be ordered in column charts. Interval/Ratio data, including age and spending, offers the most versatility for analysis and is effectively displayed in bar charts, histograms, or line charts.
Takeaways
- 📊 Data is central to statistical analysis and is collected to learn more about a phenomenon or process.
- 👥 Each thing data is collected about is called an observation, which could be a person, business, product, or period in time.
- 📈 Variables record the measurements of interest, such as age, sex, or chocolate preference, and are stored in rows and columns within a spreadsheet.
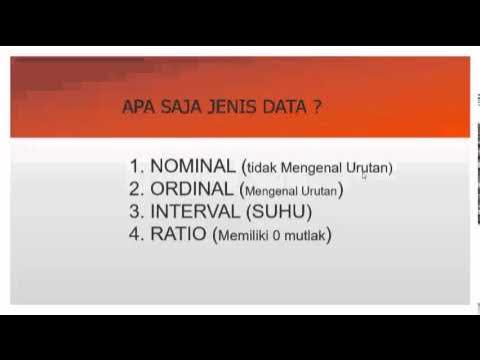
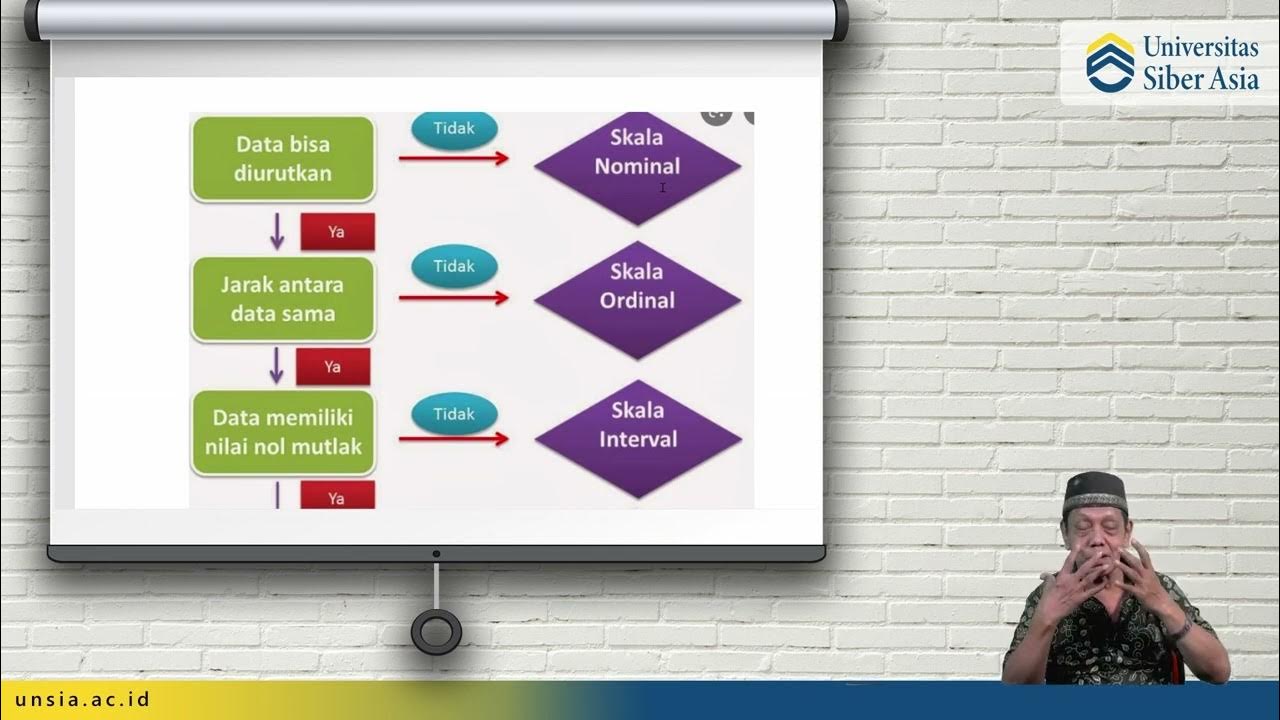
- 🔢 The level of measurement used (Nominal, Ordinal, Interval/Ratio) determines the appropriate summary statistics, graphs, and analysis.
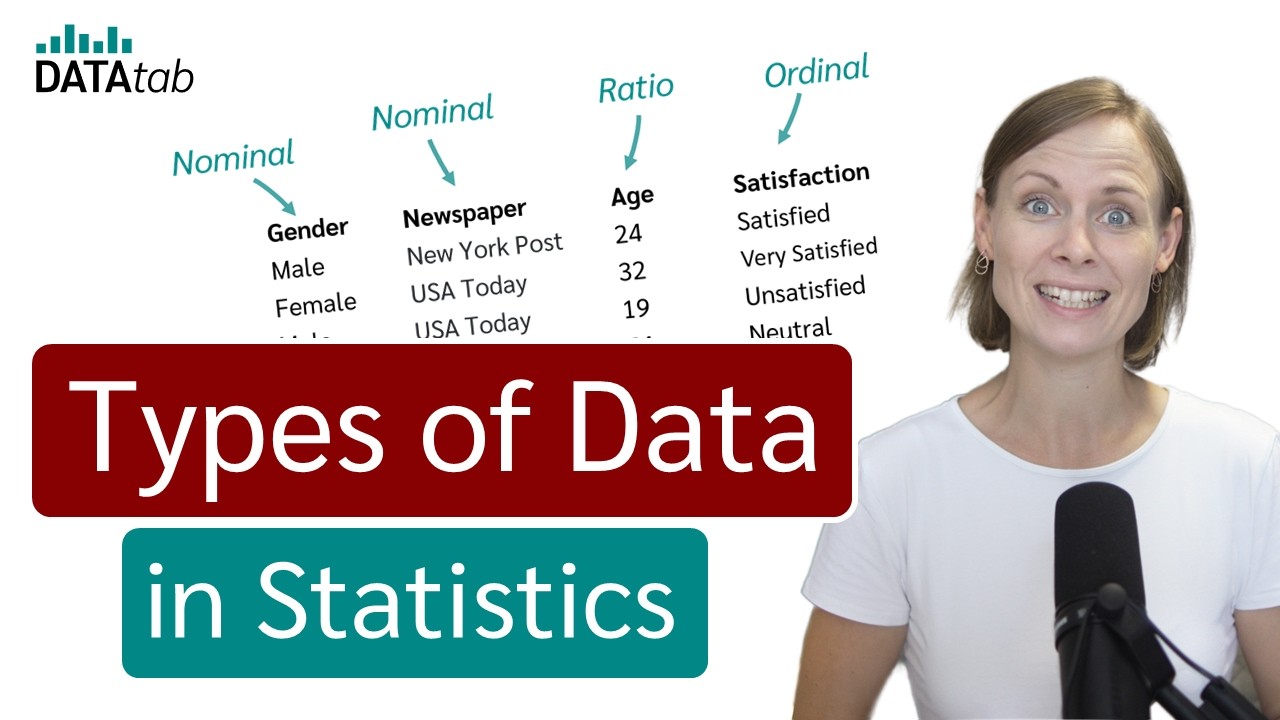
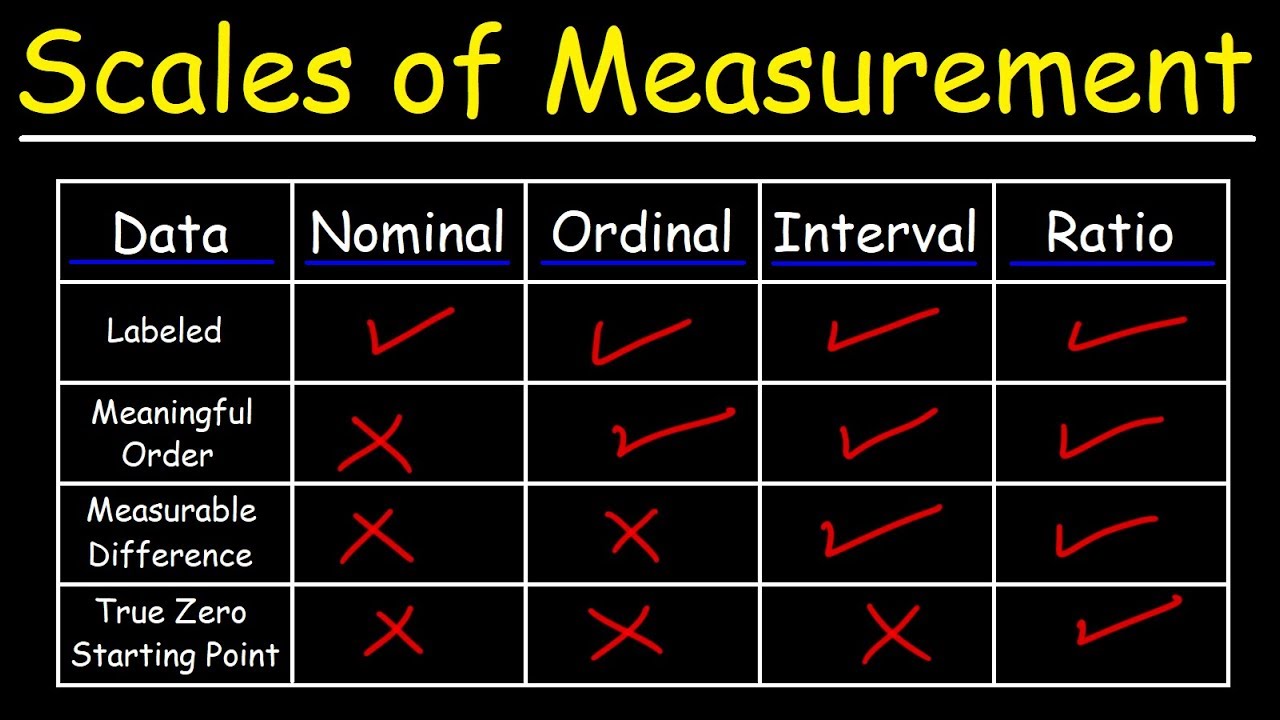
- 🏷️ Nominal data, also known as categorical or qualitative, includes labels without a sense of order, like sex or preferred chocolate type.
- 📏 Ordinal data has a meaningful order but unequal intervals between values, such as ranks or satisfaction levels.
- 📉 Interval/Ratio data is the most precise level, including measurable quantities like age, weight, or number of customers, and can be either discrete or continuous.
- 📊 The representation of data in graphs or charts depends on the level of measurement, with specific guidelines for each type.
- 🍫 In a practical example, Helen collects customer data on various variables, including nominal, ordinal, and interval/ratio data, and analyzes them using appropriate charts and summary statistics.
- 🔍 The type of analysis performed on a dataset should be based on the level of measurement of the variables.
Q & A
What is the purpose of collecting data in statistical analysis?
-The purpose of collecting data in statistical analysis is to find out more about a phenomenon or process by collecting several measures on each person or thing of interest.
What is an observation in the context of data collection?
-An observation is each thing we collect data about, which could be a person, a business, a product, or a period in time such as a week.
What is a variable in data collection?
-A variable is a characteristic or measurement that is recorded for each observation, such as age, sex, and chocolate preference.
How is data typically organized in a spreadsheet or database?
-In a spreadsheet or database, each row corresponds to a single observation, and each column represents a variable.
What is the Nominal level of measurement?
-The Nominal level is the most basic level of measurement, also known as categorical or qualitative, and includes variables like sex and preferred type of chocolate with no sense of order.
How can nominal data be summarized?
-Nominal data can be summarized using frequency or percentage, but you cannot calculate a mean or average value for it.
What is the difference between ordinal and nominal data?
-Ordinal data has a meaningful order, unlike nominal data, but the intervals between the values may not be equal. Examples include rank and satisfaction.
Is it appropriate to calculate a mean for ordinal data?
-While some argue against calculating a mean for ordinal data, it is common practice in research, especially regarding people's behavior, but one should be cautious and consider the implications.
What is the most precise level of measurement and what does it include?
-The most precise level of measurement is interval/ratio, which includes measurable quantities like the number of customers, weight, age, and size.
What are the common summary measures for interval/ratio data?
-The most common summary measures for interval/ratio data are the mean, the median, and the standard deviation.
How should different levels of data be represented graphically?
-Nominal data can be displayed as pie charts, column or bar charts. Ordinal data is best shown as a column or bar chart. Interval/ratio data is represented as bar charts, histograms, or line charts.
In the example of Helen's choconutties, what type of data is the customer's age and how should it be represented?
-The customer's age is interval/ratio data and can be represented on bar charts or histograms.
What is the significance of the mean age of Helen's customers in the sample?
-The mean age of 38 years for Helen's customers in the sample provides a meaningful summary statistic that can be used for further analysis or marketing strategies.
Outlines
📊 Understanding Data Types and Their Analysis
This paragraph introduces the fundamental concepts of data types and their significance in statistical analysis. It explains the difference between nominal, ordinal, interval, and ratio data, and how they are measured and represented. Nominal data, such as sex or chocolate preference, is categorical with no inherent order, and is summarized using frequencies or percentages. Ordinal data, like satisfaction levels, has a meaningful order but variable intervals, and its mean calculation can be controversial. Interval/Ratio data, which includes measurable quantities like age or weight, is the most mathematically versatile and can be summarized using mean, median, and standard deviation. The paragraph also discusses appropriate graphical representations for each data type, such as pie charts for nominal data and bar charts or histograms for interval/ratio data. The example of Helen's choconutties questionnaire illustrates how these concepts apply to real-world data collection and analysis.
📈 Analyzing Customer Preferences and Behavior
The second paragraph delves deeper into the analysis of the data collected by Helen through her customer questionnaire. It provides specific examples of how to summarize and interpret the different types of data. For nominal data, such as the type of chocolate preferred, percentages are used to show preferences, with 46% favoring dark chocolate, 40% milk chocolate, and 14% white chocolate. Ordinal data, including satisfaction and likelihood to purchase, should be displayed in a logical order using a column chart, and the mean satisfaction score is calculated as 2.06, indicating a 'satisfied' response, though the validity of this calculation is questioned. Interval/Ratio data, such as age, grocery spending, and chocolate bar purchases, are presented with mean values, showing the average age of 38 years, an average grocery spend of $192, and an average of 3.3 chocolate bars bought per week. The paragraph emphasizes the importance of selecting the appropriate statistical analysis based on the level of measurement of the data.
Mindmap
Keywords
💡Data
💡Observation
💡Variable
💡Level of Measurement
💡Nominal
💡Ordinal
💡Interval/Ratio
💡Summary Statistics
💡Graphs and Charts
💡Pie Chart
💡Histogram
💡Box Plot
💡Line Chart
Highlights
Data is central to statistical analysis and can be collected on various subjects like people, businesses, or time periods.
Variables record the measurements of interest, such as age, sex, and preferences, for each observation.
Data in spreadsheets is organized with each row representing an observation and each column a variable.
The level of measurement for a variable dictates the types of statistics, graphs, and analyses that can be applied.
Nominal level is the most basic, dealing with categorical data without an inherent order, like sex or color preferences.
Nominal data is summarized using frequencies or percentages, and calculating a mean is not applicable.
Ordinal level includes variables with a meaningful order but potentially unequal intervals, such as satisfaction levels.
Calculating a mean for ordinal data is common but requires careful consideration of its validity.
Interval/Ratio level is the most precise, applicable to quantifiable measurements like age, weight, and size.
Interval/Ratio data can be either discrete or continuous and allows for a wide range of mathematical analysis.
Mean, median, and standard deviation are common summary measures for Interval/Ratio data.
Data representation in graphs or charts should correspond to the level of measurement.
Nominal data is best displayed in pie charts, column charts, or bar charts.
Ordinal data should be presented in column or bar charts, avoiding pie charts.
Interval/Ratio data is optimally represented in bar charts, histograms, or line charts for time-based data.
Box plots are useful for illustrating summary statistics of a variable.
Helen's case study demonstrates how different levels of data are collected and analyzed in a real-world scenario.
Customer preferences for chocolate type are nominal and can be summarized and visualized using percentages.
Satisfaction and purchase likelihood are ordinal, requiring logical ordering in column charts.
Age, grocery spending, and chocolate bar purchases are interval/ratio data, allowing for mean calculations.
The type of analysis suitable for a dataset is determined by the level of measurement of its variables.
Transcripts
Types of data: Nominal
Ordinal Interval/Ratio
Data is central to statistical analysis
When we wish to find out more about a phenomenon or process we collect data.
Usually we collect several measures on each person or thing of interest.
Each thing we collect data about is called an observation.
If we are interested in how people respond,
then each observation will be a person.
OR an observation could be a business
or a product, or a period in time, such as a week.
Variables record the measurements we are interested in.
Age, sex and chocolate preference can all be stored as variables.
For each observation we record a score or value for each of the variables.
When we store this data in a spreadsheet or database,
each row corresponds to a single observation
and each column is a variable.
Level of measurement
The level of measurement used for a variable
determines which summary statistics,
graphs and analysis are possible and sensible.
The Nominal level is the most basic level of measurement.
Nominal is also known as categorical or qualitative.
Examples of nominal variables
are sex,
preferred type of chocolate
and colour.
These are descriptions or labels with no sense of order.
Nominal values can be stored as a word or text or given a numerical code.
However, the numbers do not imply order.
To summarise nominal data we use a frequency or percentage.
You can not calculate a mean or average value for nominal data.
The next level of measurement is ordinal.
Examples of ordinal variables are rank, satisfaction,
and fanciness!
Ordinal variables have a meaningful order,
but the intervals between the values in the scale may not be equal.
For example the gap between first and second runners in a race may be small,
whereas there is a bigger gap between second and third.
Similarly there may be a big difference between satisfied and unsatisfied,
but a smaller difference between unsatisfied and very unsatisfied.
Like Nominal data, ordinal data can be given as frequencies.
Some people state that you should never calculate a mean or average for ordinal data.
However it is quite common practice, particularly in research regarding
people's behaviour to find mean values for ordinal data.
You should be careful if you do this to think about what it means and if it is justifiable.
The most precise level of measurement is interval/ratio.
This label includes things that can be measured rather than classified or
ordered,
such as number of customers
weight, age and size.
Interval ratio data is also known as scale, quantitative or parametric.
Interval/Ratio data can be discrete, with whole numbers
or continuous, with fractional numbers.
Interval/Ratio data is very mathematically versatile.
The most common summary measures
are the mean, the median and the standard deviation.
The way data should be represented in a graph or chart depends on the level of measurement.
Nominal data can be displayed as a pie chart,
column or bar chart
or stacked column or bar chart.
In most cases the best choice for a single set of nominal data
is a column chart.
Ordinal data must not be represented as a pie chart,
but is best shown as a column or bar chart.
Interval/ratio data
is best represented as a bar chart or a histogram.
For these the data is grouped.
Box plots illustrate the summary statistics for a variable in a neat way.
Data which occurs over time is best displayed as a line chart.
Here is an example using different types of data.
Helen sells choconutties.
Helen is interested in developing a new product to add to her line of choconutties.
She develops a questionnaire and asks a random sample of 50 of her customers
to fill it out.
She asks them their age and sex, how much they spend on groceries each week,
how many chocolate bars they buy in a week,
and which they like best out of dark, milk and white chocolate.
She asks them how satisfied they are with choconutties:
very satisfied, satisfied, not satisfied, very unsatisfied.
And she asks them how likely they are to buy a whole box
of 10 packets of choconutties.
Helen enters the data in a spreadsheet.
Each row has responses from one customer.
Each column contains the measurements or scores for one variable.
The type of chocolate preferred is nominal data.
This can be shown in a pie chart or bar chart.
We can summarise by saying that 46% of customers prefer Dark chocolate,
40% prefer milk chocolate,
and 14% prefer white chocolate.
The measures of satisfaction and likelihood are ordinal level data.
These should not be shown in a pie chart.
The values should be put in a logical order in a column chart.
We could say that 32% are very satisfied with choconutties and 72% of people are satisfied or very satisfied.
and 72% of people are satisfied or very satisfied.
The average satisfaction score comes to 2.06,
which could be interpreted as satisfied.
However it is debatable whether it is sensible to calculate a mean satisfaction score.
Age, amount spent on groceries
and number of chocolate bars are all interval/ratio data.
These can be displayed on bar charts or histograms.
We can say that for the customers in the sample,
the mean age is 38 years, the mean amount spent on groceries is $192,
and the mean number of chocolate bars bought per week is 3.3.
These are all meaningful summary statistics.
The type of analysis that is sensible for a given dataset
depends on the level of measurement.
You can find out more about this in the video, "Choosing the test".
Посмотреть больше похожих видео
Nominal, Ordinal, Interval & Ratio Data: Simple Explanation With Examples
Perbedaan Statistika Parametrik dan Non Parametrik
Levels of Measurement in Statistics: Nominal, Ordinal, Interval and Ratio
02 Descriptive Statistics and Frequencies in SPSS – SPSS for Beginners
O Que é e Como Criar Gráfico de Barras com Matplotlib em Python?
Bar Charts, Pie Charts, Histograms, Stemplots, Timeplots (1.2)
5.0 / 5 (0 votes)