How to read a Topographic / Contour Map
Summary
TLDRIn this lesson, we dive into the basics of topographic maps, focusing on understanding contour lines and their role in representing the shape and elevation of the land. You'll learn how contour lines indicate areas of equal height above sea level, the importance of index contour lines, and how to calculate contour intervals. The lesson also introduces spot heights and trig stations, helping you understand how to pinpoint exact elevations. Through visualization, we compare viewing these maps from a 3D perspective, helping you read topographic maps more intuitively. With practice, you'll gain confidence in interpreting these maps.
Takeaways
- 😀 Topographic maps show the shape of the land, including both natural and man-made features like mountains, rivers, and roads.
- 😀 Contour lines are imaginary lines that connect points of equal elevation above sea level, helping to represent the 3D landforms on a 2D map.
- 😀 The number on a contour line (e.g., 550) represents the height above sea level at that specific line, and you can follow it anywhere along the line.
- 😀 The difference in elevation between consecutive contour lines is called the contour interval, and it can be calculated by dividing the height difference by the number of lines between them.
- 😀 Index contour lines are thicker and darker, making them easier to identify. Only these lines have elevation numbers to avoid cluttering the map.
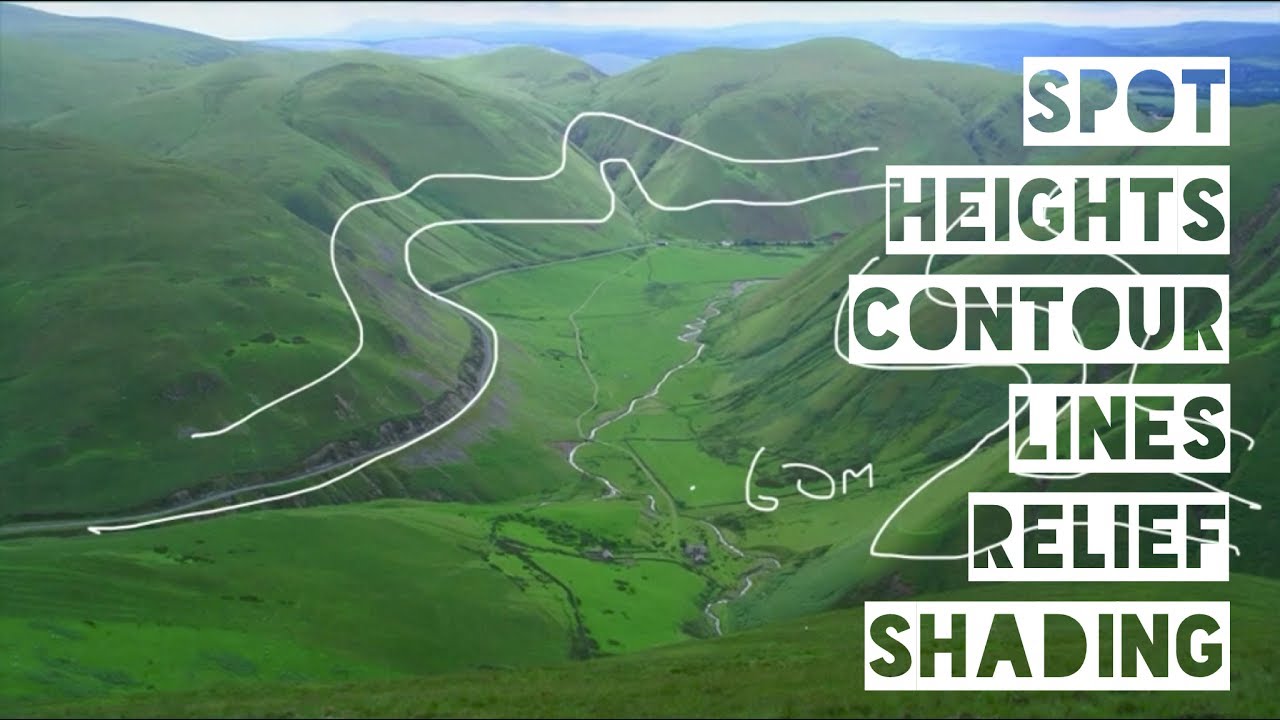
- 😀 Spot heights are points on the map that indicate the exact elevation at that location, typically marked by a dot.
- 😀 Trig stations (or trig points) are special points marked on topographic maps that help with triangulation and mapping, often found on hills.
- 😀 To interpret contour lines effectively, it's essential to visualize the map from a 3D perspective, like imagining flying over the landscape in a helicopter.
- 😀 Understanding and reading topographic maps requires practice, as it can be confusing at first, especially for beginners.
- 😀 The next lesson will cover how to identify physical features on topographic maps, building on the concepts introduced in this lesson.
Q & A
What is a topographic map?
-A topographic map is a map that shows the shape of the land, including physical features like mountains, hills, rivers, and valleys. It can also display man-made features such as roads and railways.
What do contour lines represent on a topographic map?
-Contour lines are imaginary lines that connect points of equal height above sea level. They help represent the shape and elevation of the land.
What is the purpose of contour lines?
-Contour lines serve two main purposes: they indicate height above sea level and show the shape of the land, helping to visualize terrain features in 3D.
What is an index contour line?
-An index contour line is a thicker, darker line that is labeled with a specific elevation, often to make it easier to understand the elevation difference on a map.
How can you determine the elevation difference between contour lines?
-To determine the elevation difference, find two contour lines with known elevations, count the number of lines between them, and divide the difference by the number of lines to calculate the contour interval.
What is the contour interval?
-The contour interval is the vertical difference in elevation between two consecutive contour lines. It helps to understand the steepness of the terrain.
What are spot heights on a topographic map?
-Spot heights are points marked on a map that give the exact elevation of a specific location. These are usually indicated by a dot and a number representing the height above sea level.
What is a trig point (or triangulation station)?
-A trig point, also known as a triangulation station or trig station, is a marked point on the land that provides an exact height above sea level. It is often located at the top of a hill and is numbered for identification.
How should you imagine contour lines in a real-world context?
-Imagine contour lines as if someone had painted them onto the land's surface. From above, you can view these lines, which represent the shape and elevation of the terrain.
How can one improve at reading topographic maps?
-To become proficient at reading topographic maps, practice is key. Over time, with more experience, you will become better at interpreting the lines and features.
Outlines

このセクションは有料ユーザー限定です。 アクセスするには、アップグレードをお願いします。
今すぐアップグレードMindmap

このセクションは有料ユーザー限定です。 アクセスするには、アップグレードをお願いします。
今すぐアップグレードKeywords

このセクションは有料ユーザー限定です。 アクセスするには、アップグレードをお願いします。
今すぐアップグレードHighlights

このセクションは有料ユーザー限定です。 アクセスするには、アップグレードをお願いします。
今すぐアップグレードTranscripts

このセクションは有料ユーザー限定です。 アクセスするには、アップグレードをお願いします。
今すぐアップグレード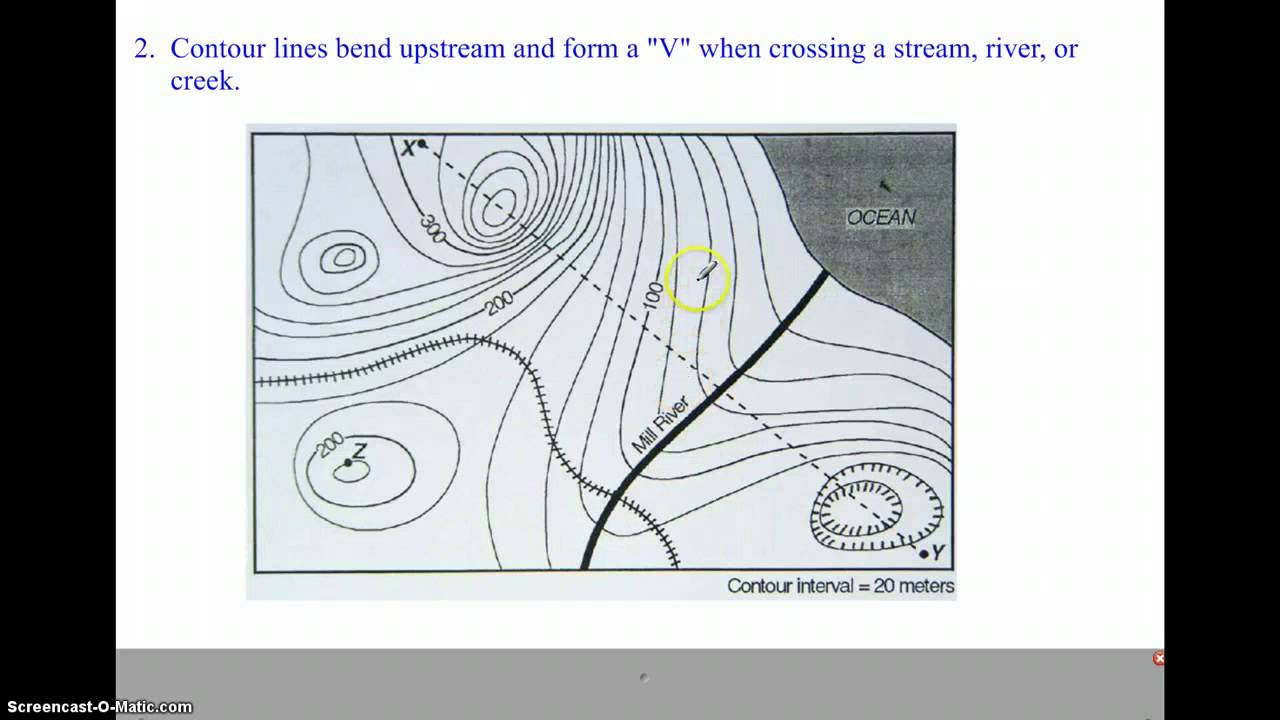


5.0 / 5 (0 votes)
