Topographic Maps, Contour Lines, and Contour Intervals
Summary
TLDRIn this video, Miss Salman provides an engaging introduction to topographic maps, explaining how they visually represent elevation changes on Earth's surface. She uses the Grand Canyon as an example to illustrate dramatic elevation shifts, which are depicted through contour lines on the map. The lesson covers key concepts like contour intervals, the rules for contour lines, and how the spacing of contour lines indicates the steepness of slopes. Miss Salman also demonstrates how to calculate contour intervals and emphasizes the importance of understanding these maps for navigating and interpreting the Earth's landscape.
Takeaways
- 😀 Topographic maps represent elevation changes using contour lines.
- 😀 Elevation is the difference in height above sea level, which is key to understanding topographic maps.
- 😀 Contour lines show areas of the same elevation; each line represents a specific elevation level.
- 😀 The closer contour lines are to each other, the steeper the slope.
- 😀 Wide spacing between contour lines indicates a gradual slope, which is easier to hike.
- 😀 Contour lines should never cross each other as each line represents a unique elevation level.
- 😀 Each point along a contour line represents the same elevation, so there cannot be two different elevations on the same line.
- 😀 Contour intervals are the vertical distance between two contour lines and are the same across the entire map.
- 😀 To calculate a contour interval, subtract the elevation of one contour line from another and divide by the number of lines between them.
- 😀 The unit of the contour interval (such as feet or meters) is important and should be noted with a space between the number and the unit.
- 😀 A steeper slope is harder to hike, while a more gradual slope is easier, which can be determined by the proximity of contour lines.
Q & A
What is a topographic map and how does it represent elevation changes?
-A topographic map uses contour lines to visually represent changes in elevation. Each contour line represents an area of the same elevation, allowing us to understand how the height of the land changes from one point to another.
What is the significance of contour lines being close together on a topographic map?
-When contour lines are close together, it indicates a steep slope, meaning there is a larger elevation change over a shorter distance. This suggests a steep area that would be more difficult to hike.
What does it mean when contour lines are far apart on a map?
-When contour lines are far apart, it indicates a more gradual slope. This means the elevation changes more slowly, making it easier to hike or move across that area.
What are the four important rules of contour lines on a topographic map?
-The four important rules of contour lines are: 1) Every point along a contour line represents the same elevation, 2) Contour lines eventually connect with themselves, 3) Contour lines never cross, and 4) Contour lines will not split or branch off.
How do you calculate the contour interval on a topographic map?
-To calculate the contour interval, subtract the elevation of one index contour line from the elevation of another, and then divide the result by the number of lines between them. This gives the elevation change per contour line.
What is an index contour line?
-An index contour line is a bold, labeled contour line that shows the elevation at specific points on the map. These lines help to make it easier to understand the elevation of the area.
Why do contour lines never cross each other?
-Contour lines never cross each other because each line represents a specific elevation. If they crossed, it would imply that a single point has two different elevations, which is not possible.
How does the contour interval affect the accuracy of the map?
-The contour interval determines the precision of the elevation changes shown on the map. A smaller contour interval gives more detail by showing smaller changes in elevation, while a larger interval gives less detailed but more general information about the terrain.
What is the difference between a steep slope and a gradual slope on a topographic map?
-A steep slope is indicated by contour lines that are close together, showing a large change in elevation over a small distance. A gradual slope is indicated by contour lines that are farther apart, showing a slow, gradual change in elevation over a larger distance.
How would you identify if a map uses feet or meters for elevation measurements?
-If the unit is not explicitly mentioned, you can calculate the contour interval and deduce the unit by context. If the map labels use 'feet' or 'meters,' you would use that unit when determining the contour interval. For example, '10 feet' or '10 meters' would indicate the unit for elevation change.
Outlines

This section is available to paid users only. Please upgrade to access this part.
Upgrade NowMindmap

This section is available to paid users only. Please upgrade to access this part.
Upgrade NowKeywords

This section is available to paid users only. Please upgrade to access this part.
Upgrade NowHighlights

This section is available to paid users only. Please upgrade to access this part.
Upgrade NowTranscripts

This section is available to paid users only. Please upgrade to access this part.
Upgrade Now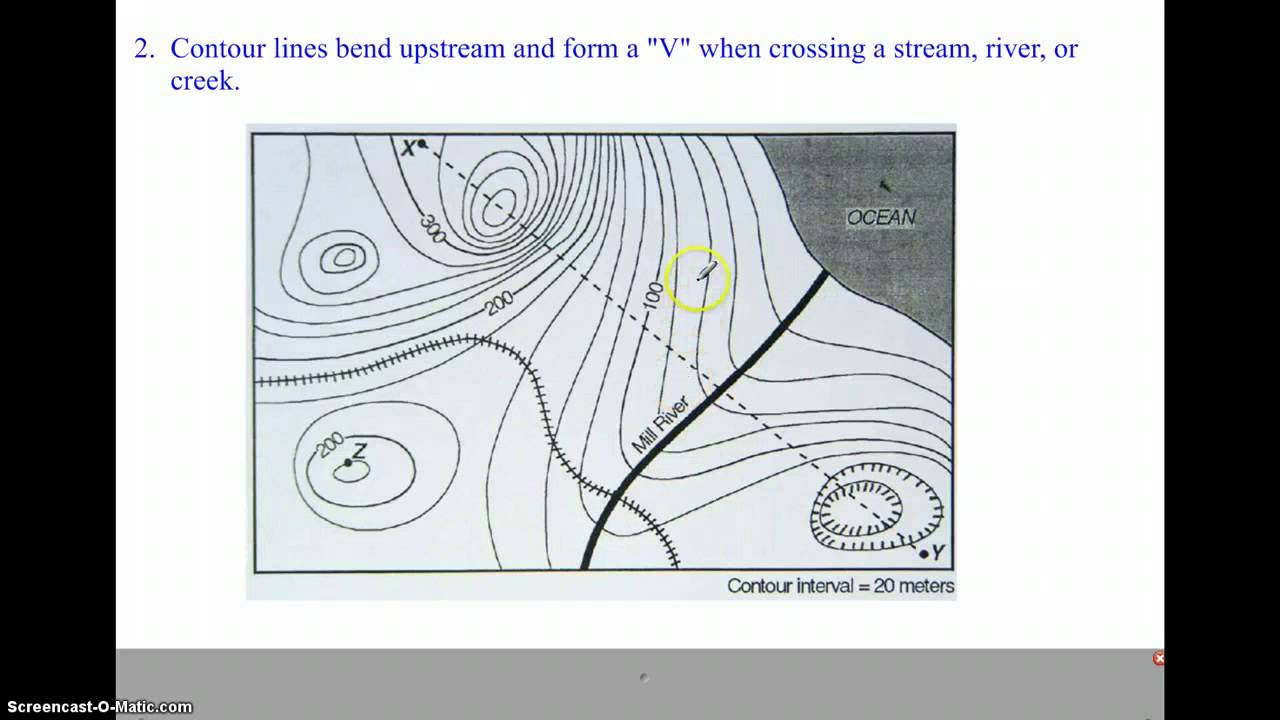


5.0 / 5 (0 votes)