Cara Memasukkan Data Awal Sampai Pengolahan Data dari Excel ke SPSS
Summary
TLDRThis tutorial explains how to input and analyze research data using SPSS. It covers how to enter data from a questionnaire, focusing on variables like leadership, work discipline, motivation, and teacher performance. The process involves organizing data in Excel and then importing it into SPSS for analysis. The guide includes setting up variables, categorizing data (e.g., gender, education), and performing statistical tests like frequency distributions and regression analysis. The video is a step-by-step guide to help beginners navigate the data processing and analysis process efficiently.
Takeaways
- 😀 Data collection starts with distributing a questionnaire containing variables like leadership, work discipline, motivation, and teacher performance.
- 😀 The responses from 67 participants are recorded, with Likert-scale scores for each item and total scores calculated for each respondent.
- 😀 Data is first entered into Excel, where each respondent's answers to different items are recorded across various variables.
- 😀 In SPSS, variables are set up by specifying their names (e.g., 'JK' for gender, 'Pendidikan' for education) and adding appropriate labels.
- 😀 Categorical variables like gender and education are coded numerically (e.g., 1 for male, 2 for female, 1 for S1 education).
- 😀 After entering the data into SPSS, you can quickly copy from Excel and paste into the software for further analysis.
- 😀 Descriptive statistics like frequency distributions can be used to summarize the data, such as finding the number of respondents for each category (e.g., gender, education level).
- 😀 Parametric tests, like multiple regression analysis, can be used to examine the relationship between independent variables (e.g., leadership, motivation) and the dependent variable (teacher performance).
- 😀 Non-parametric tests require categorizing numeric data into predefined ranges (e.g., leadership scores are classified as 'good' or 'high' based on specific score ranges).
- 😀 It’s important to use the 'transform' feature in SPSS to convert numeric data into categories when using non-parametric tests.
- 😀 After setting up and categorizing data, users can proceed to statistical analyses such as regression or frequency distributions to interpret the results and gain insights from the data.
Q & A
What is the first step in preparing research data for analysis?
-The first step is to input the research data from the questionnaire into Excel, organizing the responses by items and respondents.
How should you label categorical variables like gender and education in SPSS?
-Categorical variables like gender and education should be labeled in the 'Value' column in SPSS. For example, 1 can represent 'Male' and 2 for 'Female'. Similarly, education can be labeled as 1 for 'S1' and 2 for 'S2'.
What is the purpose of creating variables in SPSS after entering data?
-Creating variables in SPSS allows you to define the data for analysis, setting up each variable with a label and the corresponding data for statistical analysis.
How should non-parametric data be prepared in SPSS?
-Non-parametric data should be transformed into categorical variables, using SPSS's 'Transform' menu to categorize the numerical values into specific ranges, such as 'low', 'medium', or 'high'.
What type of statistical analysis is used for continuous data with assumptions of normality?
-For continuous data with assumptions of normality, parametric tests like multiple linear regression are used to analyze the relationships between variables.
Can data be analyzed directly in SPSS from Excel?
-Yes, data can be analyzed directly in SPSS after being inputted into Excel. You can copy and paste the data from Excel into SPSS for further analysis.
What is the significance of 'Value Labels' in SPSS?
-'Value Labels' in SPSS allow you to associate a numerical value with a descriptive label, which makes the data easier to interpret and understand during analysis.
How can descriptive statistics help in analyzing research data?
-Descriptive statistics provide insights into the distribution and frequency of data, such as the number of male and female respondents or the breakdown of education levels. This is useful for summarizing and understanding the data before further analysis.
What is the role of 'Descriptive Statistics' in analyzing demographic variables?
-Descriptive statistics for demographic variables, such as gender, age, and education, help summarize the characteristics of respondents, which are important for understanding the context of the study.
What is the process for performing regression analysis in SPSS?
-To perform regression analysis in SPSS, you need to select the dependent and independent variables, such as leadership or teacher performance, and run the regression analysis to identify relationships and predict outcomes.
Outlines

このセクションは有料ユーザー限定です。 アクセスするには、アップグレードをお願いします。
今すぐアップグレードMindmap

このセクションは有料ユーザー限定です。 アクセスするには、アップグレードをお願いします。
今すぐアップグレードKeywords

このセクションは有料ユーザー限定です。 アクセスするには、アップグレードをお願いします。
今すぐアップグレードHighlights

このセクションは有料ユーザー限定です。 アクセスするには、アップグレードをお願いします。
今すぐアップグレードTranscripts

このセクションは有料ユーザー限定です。 アクセスするには、アップグレードをお願いします。
今すぐアップグレード関連動画をさらに表示
02 Descriptive Statistics and Frequencies in SPSS – SPSS for Beginners
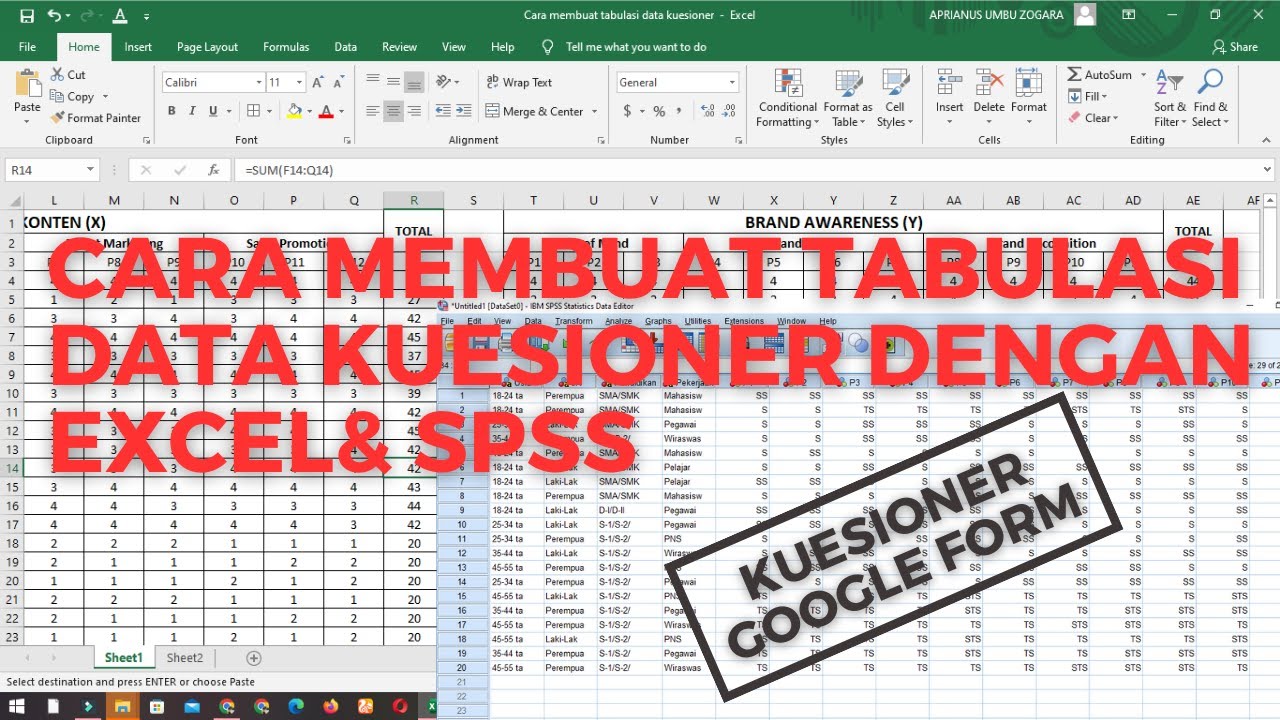
Cara Membuat Tabulasi Data Kuesioner Dengan Excel & SPSS

Dongeng tentang uji validitas Cara uji validitas spss 23, cara baca output
CARA MEMASUKKAN DATA KUESIONER KE SPSS - Beserta Uji Statistik Deskriptif

ANALISIS STATISTIK DESKRIPTIF (FREKUENSI DAN DESKRIPTIF) DENGAN SPSS

Cara analisis UNIVARIAT pada aplikasi SPSS
5.0 / 5 (0 votes)
