Cara Membuat Tabulasi Data Kuesioner Dengan Excel & SPSS
Summary
TLDRThis tutorial demonstrates how to tabulate questionnaire data using Excel and SPSS, focusing on an online survey about Instagram content promotion and brand awareness for Shopee Food followers. The process covers organizing data in Excel, such as entering respondent characteristics and Likert scale responses, calculating totals, and transferring the data into SPSS for further analysis. Viewers are shown how to format variables, input raw data, and manage coded responses. The tutorial emphasizes clear data organization and easy steps for beginners to follow when preparing data for research analysis.
Takeaways
- 😀 Understand how to create data tabulations using Excel and SPSS.
- 😀 The survey is based on online data collected through Google Forms.
- 😀 The study focuses on the influence of Instagram content promotion on brand awareness.
- 😀 The questionnaire includes questions about respondent identity (age, gender, education, and job).
- 😀 Content promotion has four indicators: advertising, publicity, direct marketing, and sales promotion, each with three items.
- 😀 The answers are measured using a Likert scale ranging from Strongly Disagree (1) to Strongly Agree (4).
- 😀 Data collected from Google Forms is exported to Excel for initial organization.
- 😀 In Excel, variables such as respondent characteristics and survey responses are tabulated.
- 😀 Use Excel functions to calculate totals for variables like content promotion and brand awareness.
- 😀 In SPSS, data is entered in variables like 'P1' to 'P12' for content promotion, and 'ba1' to 'ba2' for brand awareness, with proper coding for responses.
Q & A
What is the purpose of the video?
-The video explains how to create a data tabulation from an online questionnaire using Excel and SPSS, with a focus on analyzing responses to a survey about Instagram promotions and brand awareness for Shopee Food.
What tools are mentioned for data tabulation and analysis?
-The tools mentioned for data tabulation and analysis are Excel and SPSS.
What type of survey data is being processed in the video?
-The survey data comes from a Google Form, where respondents answer questions regarding Instagram promotions and their impact on brand awareness for Shopee Food.
What are the main variables in the survey?
-The main variables in the survey are 'promotion content' as the independent variable and 'brand awareness' as the dependent variable.
What scale is used in the survey for responses?
-The survey uses a Likert scale for responses, with values ranging from 'Strongly Disagree' (1) to 'Strongly Agree' (4).
What categories are included in the survey besides demographic information?
-Besides demographic information (age, gender, education, occupation), the survey includes sections on promotion content (advertising, publicity, direct marketing, and sales promotion) and brand awareness.
How is the data organized in Excel before transferring to SPSS?
-In Excel, the data is organized by respondent characteristics and survey sections. For each variable, the total score is calculated, and each question is grouped according to its respective indicator (promotion content or brand awareness).
What is the purpose of calculating totals in Excel?
-Calculating totals in Excel helps to summarize the responses for each section (promotion content and brand awareness) before transferring the data to SPSS for further analysis.
How is data transferred from Excel to SPSS?
-The data from Excel is copied and pasted into SPSS, where variables such as respondent demographics and Likert-scale items are inputted. The responses are then coded in SPSS using values corresponding to the Likert scale.
What is the significance of using the 'Value' feature in SPSS?
-The 'Value' feature in SPSS is used to assign numeric values to categorical responses on the Likert scale, such as '1' for Strongly Disagree, '2' for Disagree, '3' for Agree, and '4' for Strongly Agree. This allows the data to be properly analyzed.
Outlines

This section is available to paid users only. Please upgrade to access this part.
Upgrade NowMindmap

This section is available to paid users only. Please upgrade to access this part.
Upgrade NowKeywords

This section is available to paid users only. Please upgrade to access this part.
Upgrade NowHighlights

This section is available to paid users only. Please upgrade to access this part.
Upgrade NowTranscripts

This section is available to paid users only. Please upgrade to access this part.
Upgrade NowBrowse More Related Video

Cara Membuat Tabulasi Data Kuesioner di Excel dan SPSS (Contoh Kuesioner Google Form)
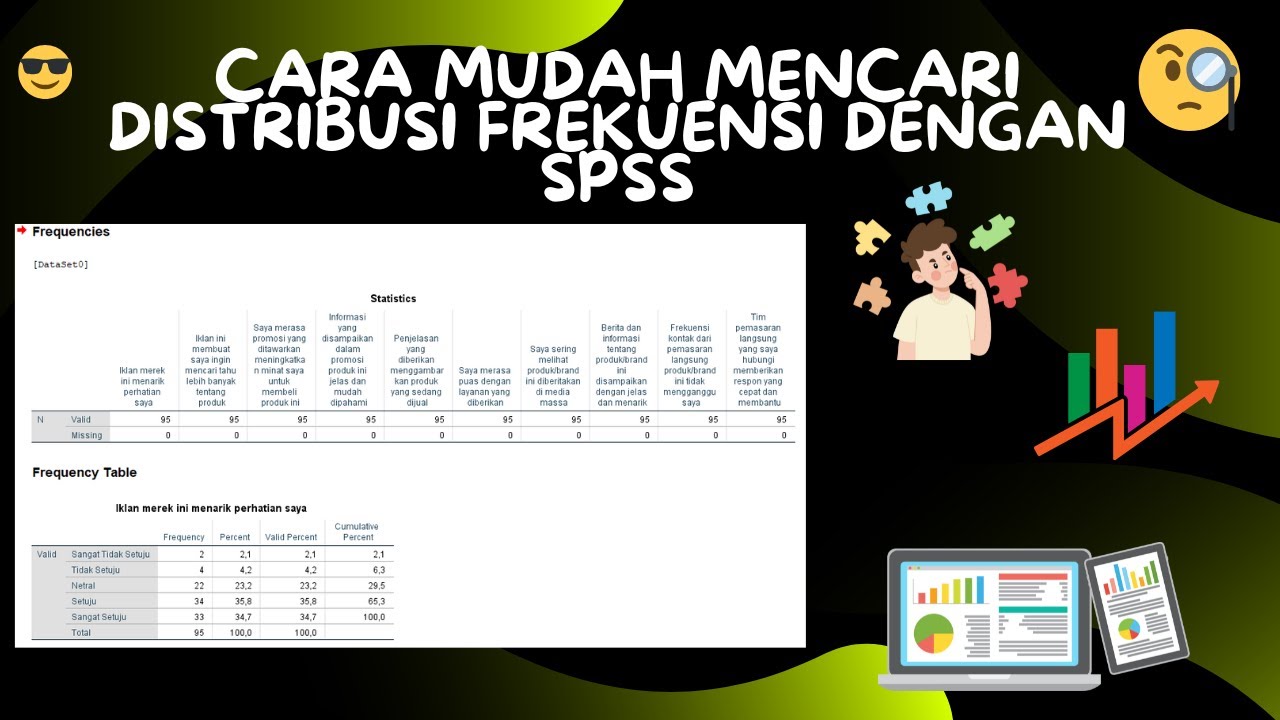
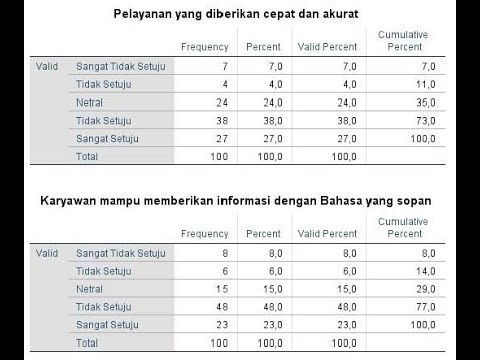
Cara Mudah Mencari Distribusi Frekuensi Dengan SPSS

Dongeng tentang uji validitas Cara uji validitas spss 23, cara baca output
Cara Mudah membuat Distribusi Jawaban Responden dengan SPSS
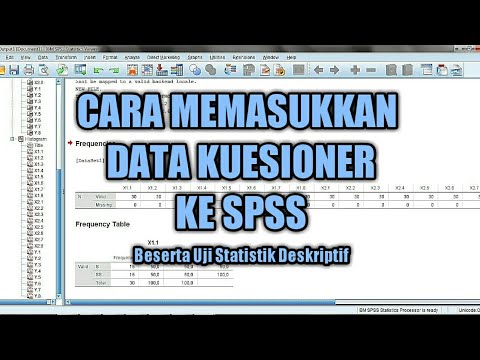
CARA MEMASUKKAN DATA KUESIONER KE SPSS - Beserta Uji Statistik Deskriptif

CARA ANALISA DESKRIPTIF TINGKAT CAPAIAN RESPONDEN,TCR,TOTAL SKOR,RATA RATA,MEAN,KATEGORI,EXCEL SPSS
5.0 / 5 (0 votes)