Cara analisis UNIVARIAT pada aplikasi SPSS
Summary
TLDRIn this video, Muhammad Naim explains how to conduct a univariate test using SPSS. He defines the univariate test as a method to analyze the distribution of research variables by calculating the frequency and percentage of each. The video walks through preparing and entering data, including gender, education, age, and hypertension, and then performing a frequency test to interpret the results. Naim emphasizes the importance of coding data correctly in SPSS and demonstrates how to process and analyze the data, helping viewers understand respondent distributions and how to apply these results to their studies or theses.
Takeaways
- 😀 Univariate test is used to analyze the distribution of research subjects by calculating frequencies and percentages for each research variable.
- 😀 According to Pijianto (2020), univariate analysis provides an overview of respondents' characteristics in a study.
- 😀 SPSS software is used to input and process data, where variables such as gender, education, age, and hypertension are coded.
- 😀 Gender data is coded with '1' for males and '2' for females in the dataset.
- 😀 Educational levels are assigned specific codes: '1' for SMA, '2' for diploma, '3' for S1, and '4' for S2.
- 😀 Age is categorized into two groups: '1' for under 30 years and '2' for over 30 years.
- 😀 Hypertension responses are coded as '1' for 'Yes' and blank (or '0') for 'No'.
- 😀 Data is entered into SPSS, where the code for each variable is carefully entered to ensure accuracy.
- 😀 After entering the data, a univariate (or frequency) test is conducted using SPSS to calculate the frequency of each variable.
- 😀 SPSS outputs the frequency table, showing the percentage distribution of respondents across variables like gender, age, hypertension, and education.
- 😀 The univariate test allows researchers to understand the percentage distribution of each variable, such as the proportion of men and women or the age distribution of respondents.
Q & A
What is a univariate test in the context of this tutorial?
-A univariate test is a statistical test used to analyze the distribution of research subjects by calculating the frequency and percentage of each variable in a study. It helps in understanding the characteristics of respondents in a study, such as their gender, age, education, and health status.
Who is the author cited in the script and what does their work contribute to the understanding of univariate analysis?
-The author cited in the script is Pijianto (2020), who defines univariate analysis as an analysis that provides an overview of the characteristics of study respondents. This definition helps establish the foundational purpose of conducting univariate tests in research.
What variables are being analyzed in the univariate test example presented in the video?
-The variables analyzed in the example include Gender, Education, Age, and Hypertension status. Each of these variables is coded for analysis in SPSS.
How is gender coded in the data for the univariate test?
-Gender is coded as follows: 1 for Male and 2 for Female. These codes are entered into SPSS to represent the gender of the respondents.
What is the significance of 'valid' and 'missing' in the frequency table output?
-In the frequency table output, 'valid' refers to the number of respondents with valid data for each variable, while 'missing' indicates the number of respondents for whom the data is absent or incomplete. A correct analysis should show all data as valid with no missing entries.
What does the term 'cumulative percentage' mean in the frequency table results?
-Cumulative percentage refers to the running total percentage of respondents up to each category in the variable. For instance, if 33.3% of respondents are under 30 and 66.7% are over 30, the cumulative percentage for over 30 would be 100%.
What are the four education categories coded in the data, and what do the codes represent?
-The four education categories are: 1 = High School, 2 = Diploma, 3 = S1 (Bachelor's degree), and 4 = S2 (Master's degree). These codes are used in SPSS to represent the education levels of the respondents.
How does the univariate test help in reporting results in a research study?
-The univariate test helps by summarizing the distribution of variables across respondents. This summary is useful in understanding patterns and making sense of the data for research reports, such as in determining how many respondents fall into each category for variables like age, gender, or education.
What should you do if the frequency table shows missing data?
-If the frequency table shows missing data, it indicates that there are incomplete responses in the dataset. You should review the data entry process to identify and correct any issues, such as improper coding or missing values, to ensure an accurate analysis.
How does SPSS help in performing a univariate test?
-SPSS simplifies the process of conducting a univariate test by allowing users to input coded data, select the variables for analysis, and automatically generate frequency tables. SPSS also provides visual aids like bar charts or histograms to help interpret the results.
Outlines

This section is available to paid users only. Please upgrade to access this part.
Upgrade NowMindmap

This section is available to paid users only. Please upgrade to access this part.
Upgrade NowKeywords

This section is available to paid users only. Please upgrade to access this part.
Upgrade NowHighlights

This section is available to paid users only. Please upgrade to access this part.
Upgrade NowTranscripts

This section is available to paid users only. Please upgrade to access this part.
Upgrade NowBrowse More Related Video

Cara Uji Asumsi Klasik: Normalitas, Multikolinearitas dan Heteroskedastisitas Menggunakan SPSS
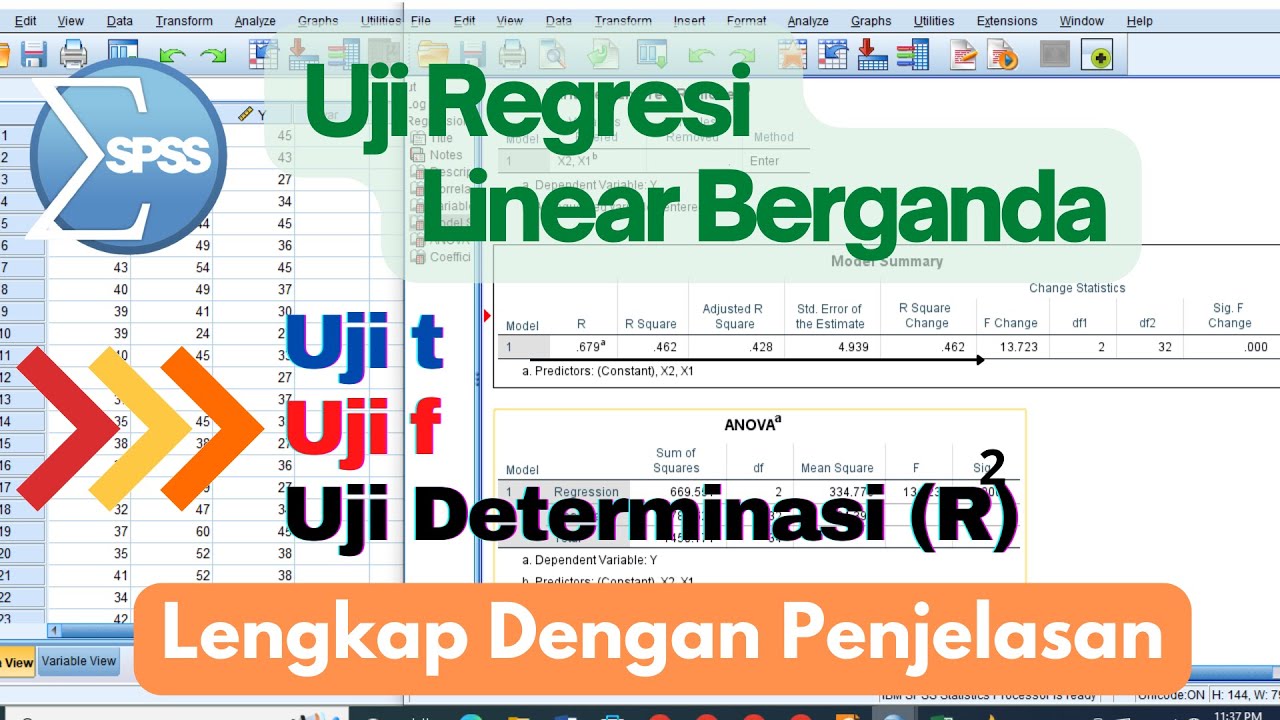
Cara Uji Regresi Linear Berganda ( Uji t, Uji f dan Uji Determinasi) menggunakan aplikasi SPSS
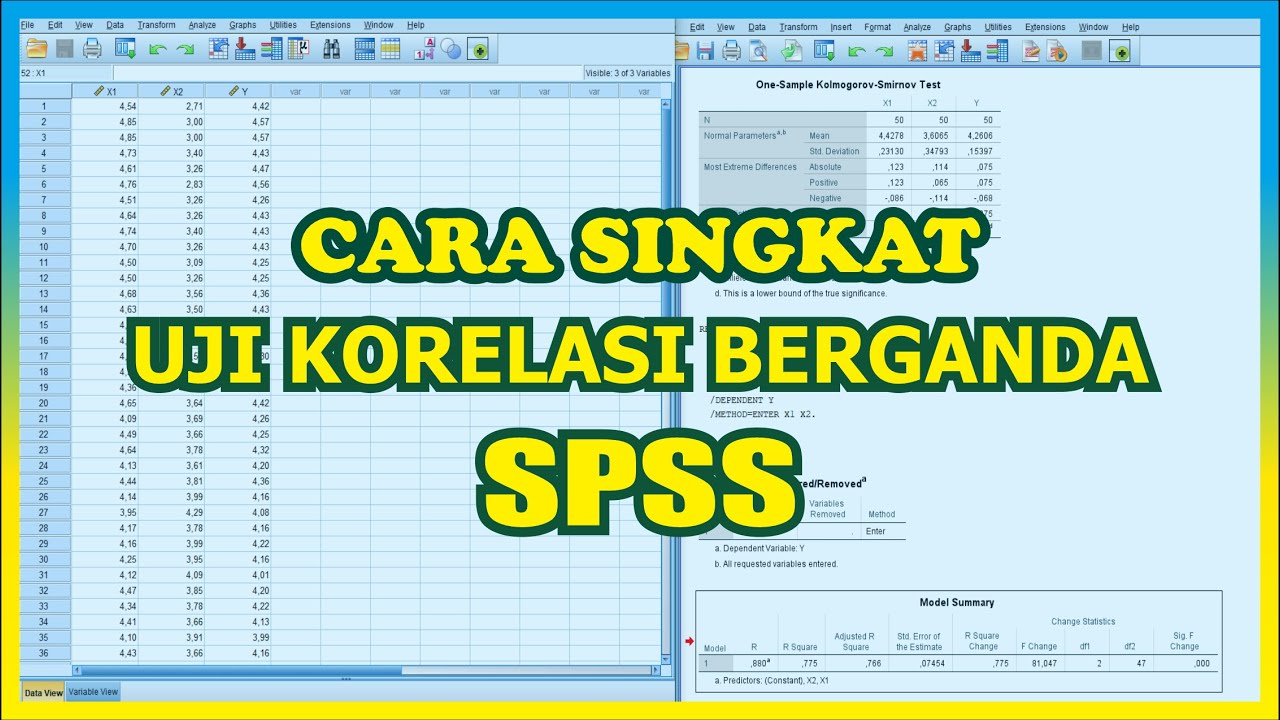
TUTORIAL SPSS : Multiple Correlation Test SPSS

Dongeng tentang uji validitas Cara uji validitas spss 23, cara baca output

Cara Uji Normalitas dan Homogenitas Menggunakan SPSS dengan Mudah
Tutorial Menggunakan Spss untuk data Panel
5.0 / 5 (0 votes)