CARA MEMASUKKAN DATA KUESIONER KE SPSS - Beserta Uji Statistik Deskriptif
Summary
TLDRThis tutorial video guides viewers through the process of inputting and analyzing Likert scale questionnaire data using SPSS. The presenter explains how to create a data recap in Excel, format it for SPSS, and input it into the software. The video also covers steps like labeling responses, setting up variables, and performing descriptive statistical analysis. The presenter emphasizes practical tips for organizing and interpreting data, making the video ideal for anyone working with survey data and statistical analysis using SPSS.
Takeaways
- 😀 Data from a Likert scale questionnaire is initially recapped in Excel, with responses from 30 respondents organized by statement and variable.
- 😀 The questionnaire data is tabulated with the Likert scale values (1 to 5) and summed up for each respondent.
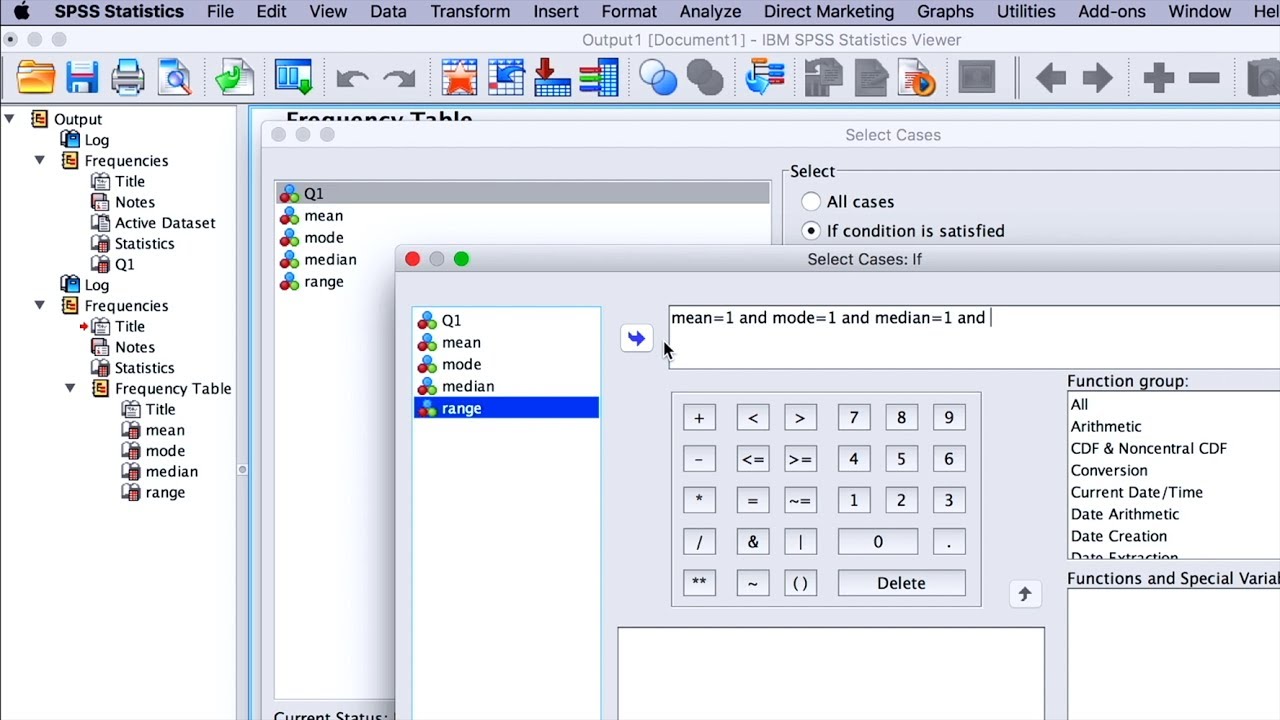
- 😀 SPSS is used for further analysis, starting with setting up the variable view for the questions in the questionnaire.
- 😀 Each variable is represented by a statement (e.g., X1.1 for the first statement of variable X1), and the total for each variable is also recorded in SPSS.
- 😀 The Likert scale values (1 = Strongly Disagree, 2 = Disagree, 3 = Neutral, 4 = Agree, 5 = Strongly Agree) are inputted as value labels in SPSS.
- 😀 After inputting the data, the next step is to save the file to prevent re-entering the data later on.
- 😀 Descriptive statistics are run in SPSS to analyze the data, providing a summary of the responses across all respondents for each statement.
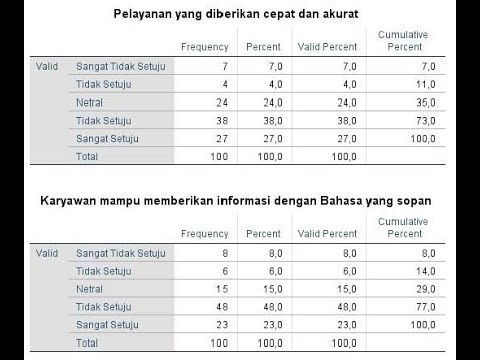
- 😀 The analysis output includes the count of responses for each Likert scale category (Strongly Agree, Agree, etc.) for each statement.
- 😀 A histogram can be generated to visualize the distribution of responses for each statement, making it easier to interpret the results.
- 😀 The video emphasizes the importance of organizing and validating data before performing statistical tests, such as descriptive statistics, to ensure accurate analysis.
Q & A
What is the purpose of the video tutorial?
-The purpose of the video is to guide viewers on how to input and analyze Likert scale questionnaire data using SPSS, starting from data tabulation in Excel to performing descriptive statistics in SPSS.
How does the speaker suggest organizing the questionnaire data before entering it into SPSS?
-The speaker recommends organizing the data in Excel by listing each respondent’s answers vertically and labeling the responses with numerical values corresponding to the Likert scale (1 for 'Strongly Disagree' to 5 for 'Strongly Agree').
What should be done after tabulating the responses in Excel?
-After tabulating the responses in Excel, the next step is to enter the data into SPSS, where the variables and responses are set up in the 'Variable View' with appropriate labels and numerical values.
How does the speaker advise handling the variables in SPSS?
-The speaker advises setting up variables in SPSS with appropriate names for each questionnaire statement, such as 'X1.1' for the first statement under variable X1, and then assigning numerical values to the responses (1-5 for Likert scale responses).
What does the speaker mention about the 'Total' column in the SPSS data?
-The speaker mentions that a 'Total' column should be created in SPSS to sum the scores for each respondent across the different statements, which helps in analyzing the overall response for each variable.
What is the significance of using value labels in SPSS?
-Value labels are used to assign meaningful names to the numerical responses, such as '1' for 'Strongly Disagree', '2' for 'Disagree', and so on, making the data more interpretable and easier to analyze in SPSS.
How can you ensure the data entered into SPSS is correctly formatted and complete?
-To ensure the data is correctly formatted, the speaker advises checking for any missing values and verifying that each respondent’s responses are entered accurately in SPSS, matching the original data from Excel.
What is the next step after entering data into SPSS?
-After entering the data into SPSS, the next step is to perform descriptive statistics by navigating to 'Analyze' and selecting 'Descriptive Statistics' to generate summary statistics such as mean, median, and mode, along with graphical representations like histograms.
How does the speaker explain the output from the descriptive statistics analysis?
-The speaker explains that the output from the descriptive statistics analysis shows the frequency distribution of responses, including the number of respondents for each Likert scale value. It also includes graphical outputs like histograms to visualize the distribution of responses.
Why does the speaker emphasize saving the dataset?
-The speaker emphasizes saving the dataset to avoid re-entering the data for future use. By saving the file, you can quickly access and use the data for additional analyses without having to repeat the data entry process.
Outlines

This section is available to paid users only. Please upgrade to access this part.
Upgrade NowMindmap

This section is available to paid users only. Please upgrade to access this part.
Upgrade NowKeywords

This section is available to paid users only. Please upgrade to access this part.
Upgrade NowHighlights

This section is available to paid users only. Please upgrade to access this part.
Upgrade NowTranscripts

This section is available to paid users only. Please upgrade to access this part.
Upgrade NowBrowse More Related Video
Cara Mudah membuat Distribusi Jawaban Responden dengan SPSS
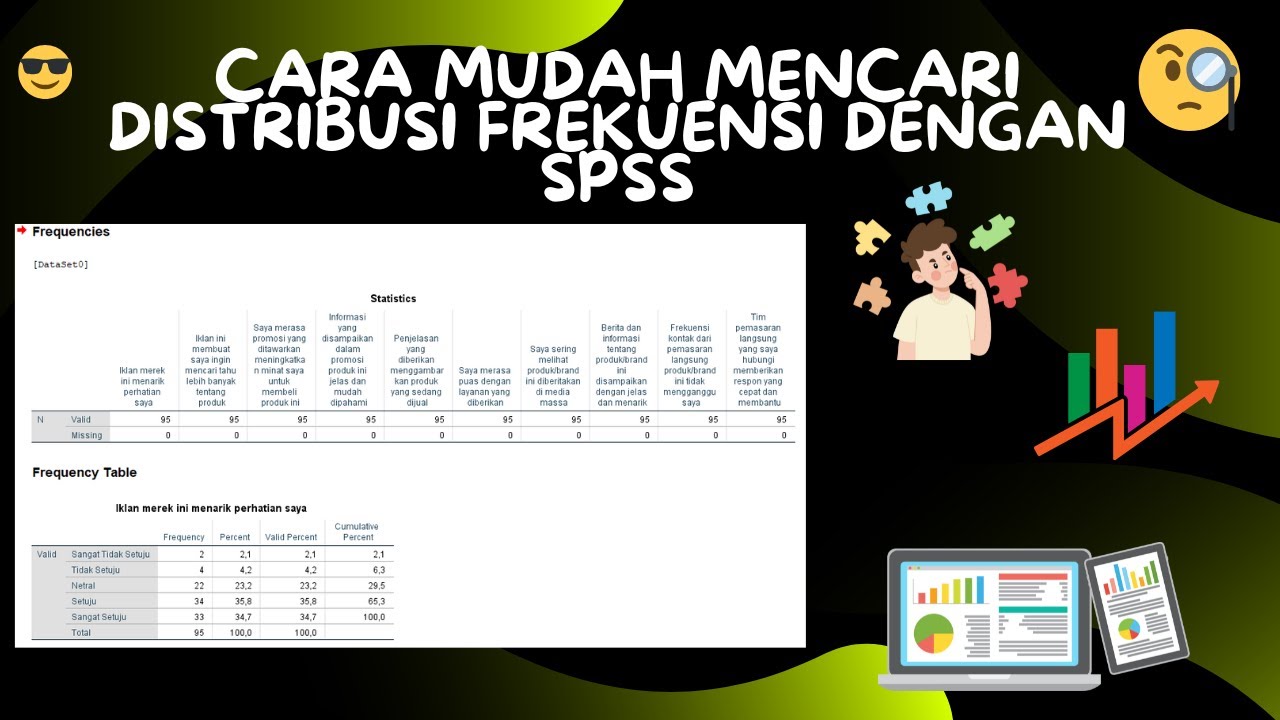
Cara Mudah Mencari Distribusi Frekuensi Dengan SPSS
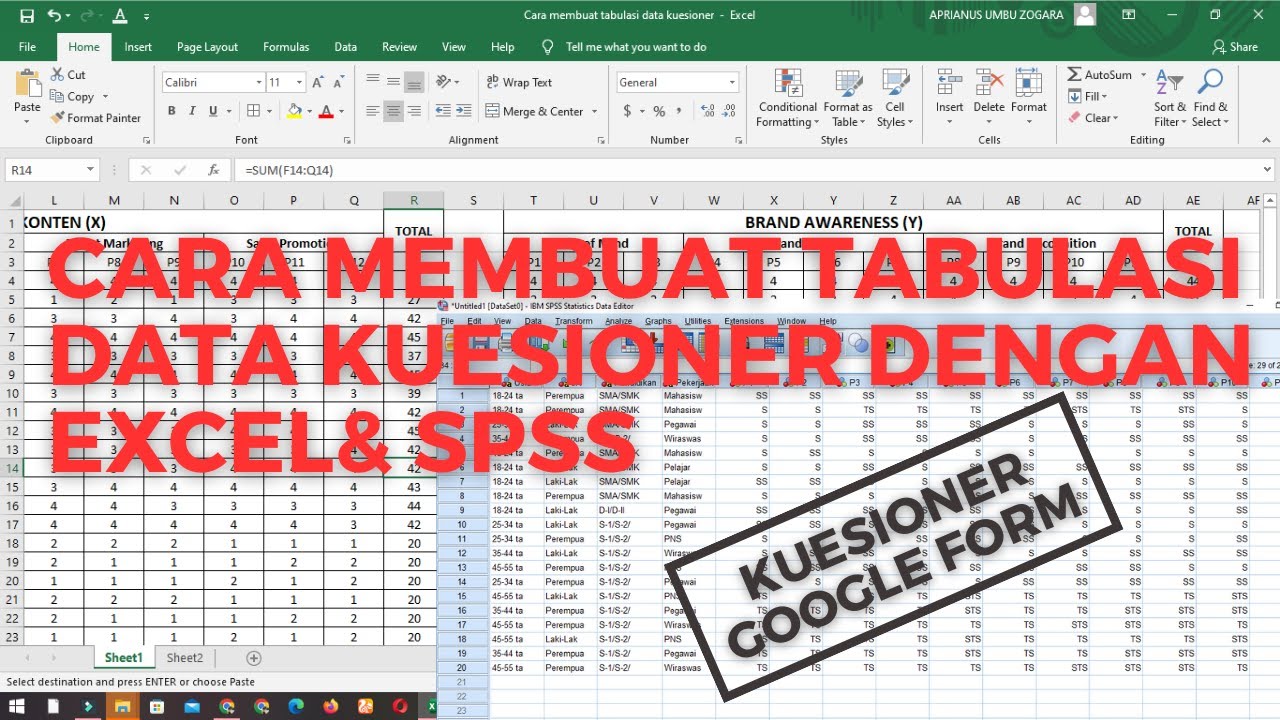
Cara Membuat Tabulasi Data Kuesioner Dengan Excel & SPSS

CARA ANALISA DESKRIPTIF TINGKAT CAPAIAN RESPONDEN,TCR,TOTAL SKOR,RATA RATA,MEAN,KATEGORI,EXCEL SPSS

Cronbach's Alpha_Reliability Analysis | Data Analysis in IBM SPSS || Explained in Filipino
SPSS: How To Enter, Code, And Analyze Multiple Choice Data
5.0 / 5 (0 votes)