Tableau Data Modeling and Layers (Physical & Logical) | #Tableau Course #33

Data with Baraa
25 Apr 202306:05

Summary

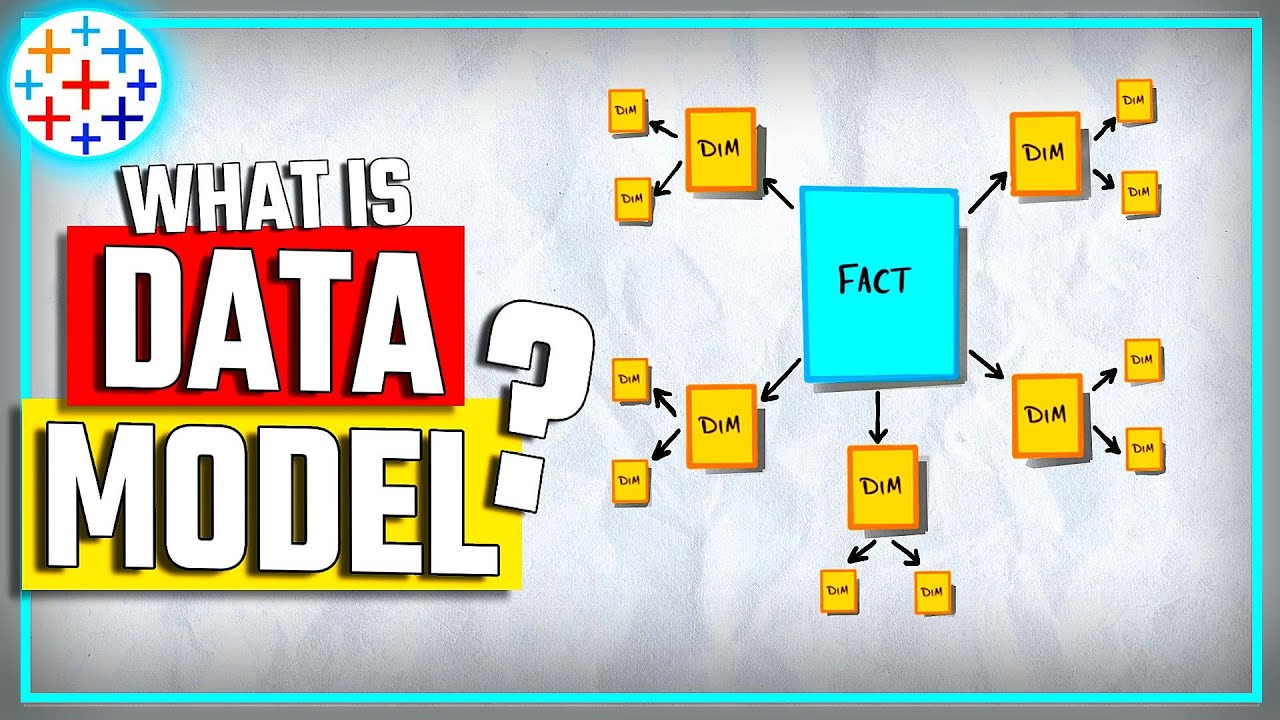
TLDRThe video provides an introduction to data modeling in Tableau, explaining how to work with both the physical and logical layers of data. It covers four methods to combine tables: joins, unions, relationships, and data blending. The physical layer allows joins and unions between tables, while the logical layer uses relationships to abstract data and simplify visualizations. The video also touches on how to navigate between these layers and introduces data blending for combining data from different sources at the visualization level.

Takeaways

  • 📊 **Data Modeling in Tableau**: Tableau allows creating a data model from a data source which can include multiple tables.
  • 🔗 **Four Methods of Combining Tables**: Tableau offers relationships, joins, unions, and data blending to combine tables.
  • 🏗️ **Physical and Logical Layers**: Tableau's data model consists of a physical layer with the actual data tables and a logical layer that abstracts these details.
  • 🔄 **Joins and Unions in the Physical Layer**: In the physical layer, tables can be combined using joins or unions.
  • 📚 **Logical Layer Abstraction**: The logical layer presents a single table (logical table) that can represent multiple physical tables, simplifying the data for visualizations.
  • 🔗 **Relationships in the Logical Layer**: Relationships are used in the logical layer to connect logical tables, but they do not merge them into one.
  • 🌐 **Data Blending at Visualization Level**: Data blending is used to combine data from different data sources for a single visualization.
  • 📑 **Navigating Layers**: Users can navigate between the physical and logical layers within Tableau's data source page.
  • 🔍 **Understanding Table Composition**: By hovering over icons in Tableau, users can see how logical tables are composed of physical tables.
  • 🎥 **Supporting the Channel**: The script encourages viewers to like, comment, and support the content to help with YouTube algorithm visibility.

Q & A

  • What is a data model in Tableau?

    -A data model in Tableau is a structure that defines how different tables in a data source are connected, helping organize and manage the relationships between tables for visualization.

  • What happens when your data contains only one table in Tableau?

    -When your data contains only one table, the data model is very simple, with a single table representing the entire data source.

  • What are the four methods Tableau offers for connecting and combining tables?

    -Tableau offers four methods for connecting and combining tables: relationships, joins, union, and data blending.

  • What is the difference between the physical layer and the logical layer in Tableau's data model?

    -The physical layer consists of physical tables that can be joined or combined using unions, while the logical layer abstracts these physical tables into logical tables to simplify visualization by hiding underlying details.

  • How can tables be combined in the physical layer in Tableau?

    -In the physical layer, tables can be combined using either joins or unions.

  • What is the role of relationships in the logical layer?

    -In the logical layer, relationships are used to connect logical tables without merging them into one table, which allows each logical table to maintain its own structure.

  • How do joins and unions work in the physical layer?

    -Joins in the physical layer combine rows from multiple tables based on a common field, while unions stack data from similar tables vertically, adding rows from one table to another.

  • What is data blending in Tableau?

    -Data blending in Tableau is a method used to combine data from different data sources or data models at the visualization level, allowing for unified analysis.

  • How can you navigate between the physical and logical layers in Tableau?

    -To navigate between the physical and logical layers, you can double-click on a logical table to enter the physical layer, and close it to return to the logical layer.

  • What are the steps involved in adding tables to the logical and physical layers?

    -In the logical layer, tables are added as logical tables and connected using relationships. In the physical layer, tables can be added and combined using joins or unions.

Outlines

00:00

🔗 Introduction to Data Modeling in Tableau

This paragraph introduces the concept of creating a data model in Tableau. If the data contains only one table, the model is simple. However, real-life projects usually involve multiple tables, making things more complex. Tableau offers four methods to combine and connect tables: relationships, joins, unions, and data blending. The speaker mentions that a deep dive into these methods will follow, but first explains the basics of data modeling in Tableau.

05:00

🧩 Understanding Physical and Logical Layers in Tableau

This section explains the two layers involved in Tableau's data model: the physical layer and the logical layer. The physical layer contains actual tables, which can be combined using joins or unions. The logical layer provides an abstraction, simplifying visualization by hiding the complexity of multiple physical tables. The logical layer displays merged tables as a single flat table, referred to as a logical table. Relationships are used to connect logical tables, but no actual merging happens at this level. This abstraction helps simplify data representation during visualization.

🔄 Connecting Logical Tables with Relationships

This paragraph elaborates on how logical tables remain separate after relationships are created between them. Tableau only describes relationships between logical tables without merging them. Both physical and logical layers can be accessed via Tableau's data source page. When building visualizations, users see tables from the logical layer only, and any new data models from different sources can be connected through data blending at the visualization level. The distinction between physical and logical tables is crucial for understanding data modeling.

📊 Navigating Between Logical and Physical Layers in Tableau

Here, the speaker demonstrates how to navigate through the physical and logical layers in Tableau. When users drag and drop tables into the data model, they are considered logical tables by default. Relationships between these tables are created automatically. To access the physical layer, users need to double-click on a logical table, which reveals the underlying physical tables. In the physical layer, users can create joins or unions between tables, while the logical layer abstracts them as single logical tables.

🧮 Examining Relationships and Joins in Tableau

This section discusses how Tableau represents relationships and joins between physical tables. For instance, the speaker explains that a logical table can be made up of multiple physical tables combined through joins, which Tableau automatically detects. Users can hover over icons to view how physical tables define the logical table. In contrast, some logical tables, like 'Orders,' can directly pull data from the source system without any underlying physical tables. This flexibility allows users to efficiently manage different types of data connections in Tableau.

🚀 Conclusion: Summary of Tableau Data Modeling

In this final paragraph, the speaker recaps the concepts of navigating between physical and logical layers in Tableau. They highlight the importance of understanding the data modeling process and emphasize the upcoming lessons on how to combine tables using joins. The speaker also encourages viewers to support their YouTube channel by liking and commenting, noting that engagement helps with the YouTube algorithm. The video concludes with a brief farewell.

Mindmap

Keywords

💡Data model

A data model in Tableau represents how data is structured and organized for analysis. It can be simple with just one table or more complex with multiple tables that are combined through different methods. In the video, the data model is discussed as having two layers—physical and logical—that help in building visualizations.

💡Physical layer

The physical layer in Tableau is the foundational level where actual tables are connected and combined using methods like joins and unions. In the video, this layer is where users work directly with their raw data tables before presenting them in a more abstract form in the logical layer.

💡Logical layer

The logical layer is an abstraction of the physical layer where the detailed structure of multiple tables is hidden, and only simplified versions of the data are shown. This helps to streamline the visualization process in Tableau. The video describes how this layer consolidates physical tables into 'logical tables' without merging them.

💡Join

A join is a method used to combine tables based on a common field in Tableau's physical layer. This method merges data from two or more tables to create a single table, making it easier to analyze related data. In the video, joins are highlighted as one of the key techniques for merging tables in the physical layer.

💡Union

A union in Tableau is a method that combines tables by stacking them on top of each other, often used when the tables have similar structures or columns. It allows users to work with data from multiple sources without merging it entirely. In the video, unions are described as another method for combining tables in the physical layer.

💡Relationship

A relationship is a way to connect different logical tables without merging them, allowing users to analyze the tables while maintaining their individuality. In the video, relationships are presented as the only method to connect tables in the logical layer.

💡Data blending

Data blending in Tableau is a technique used to combine data from multiple sources or data models at the visualization level. It allows users to bring together data without integrating it in the physical or logical layers. The video mentions data blending as a unique method available at the visualization stage when working with multiple data sources.

💡Logical table

A logical table is the representation of one or more physical tables after they've been combined using joins or unions in the physical layer. These tables appear in the logical layer as single entities, hiding the complexity of the physical tables. In the video, logical tables are emphasized as the abstracted versions of physical tables.

💡Data source

A data source in Tableau refers to the set of data that has been connected to the Tableau workspace for analysis. It includes the tables and relationships defined in the data model. In the video, the data source is discussed as the starting point from which physical and logical layers are built.

💡Visualization

Visualizations in Tableau are the graphical representations of data, such as charts or graphs, built on top of the data model. The video explains how users build visualizations using data from the logical layer and occasionally blend data from multiple sources to create more complex visual representations.

Highlights

Connecting data to Tableau involves creating a data model.

Data models can be simple with a single table or complex with multiple tables.

Tableau offers four methods to combine tables: relationships, joins, Union, and data blending.

Data modeling in Tableau consists of a physical layer and a logical layer.

The physical layer may contain multiple tables combined using joins or Unions.

The logical layer provides an abstraction, hiding the details of the physical layer.

Merging tables in the physical layer results in a logical table in the logical layer.

Relationships in Tableau can only be established in the logical layer.

In the logical layer, tables cannot be merged into one; they can only be related.

Data sources in Tableau can be seen at the logical layer when building visualizations.

Logical tables can come directly from the source system, not just from physical tables.

Data blending allows combining data models or data sources at the visualization level.

Tableau's data modeling navigates between the physical and logical layers.

By default, Tableau starts at the logical layer in the data model.

Dragging tables into the data model at the logical layer creates relationships.

Accessing the physical layer is done by double-clicking into a logical table.

In the physical layer, joins and unions can be performed between tables.

Information about the composition of logical tables from physical tables is visible in Tableau.

Navigating between layers helps understand the data flow from physical to logical tables.

Learning how to combine tables in Tableau starts with understanding joins.

Supporting the channel helps improve visibility and reach.

Transcripts

play00:04

okay so once we connect our data to

play00:07

Tableau we have to create a data model

play00:09

in our data source and if your data

play00:11

contains only one table then your data

play00:14

model is very simple you have single

play00:16

table in your data model but in real

play00:18

life projects things gets more

play00:19

complicated where you have multiple

play00:21

tables and Tableau here offers four

play00:24

different methods of how to combine and

play00:26

connect your tables we have

play00:28

relationships joins Union and data

play00:31

blending and now before we start doing

play00:33

deep dive and those four methods let's

play00:35

first understand the data moduling in

play00:38

tableau

play00:39

foreign

play00:42

model we have two layers we have the

play00:45

physical layer and on top of it we have

play00:47

the logical layer in the physical layer

play00:49

we might have some couple of physical

play00:51

tables and we can combine them in

play00:53

Tableau using two methods either joining

play00:57

the tables or using Union between them

play00:59

and now let's move to The Logical layer

play01:01

it is the top level layer and provide us

play01:04

like an abstract to hide all the details

play01:06

in the physical layer this is especially

play01:09

nice if we have a lot of tables in the

play01:11

physical layer so once we are building

play01:12

our visualizations we don't want to see

play01:15

all those tables in the physical layer

play01:17

so The Logical layer can provide us like

play01:19

an abstract organ hide all those details

play01:22

so the result of merging the tables

play01:24

using join and Union in the physical

play01:26

layer gonna be presented in The Logical

play01:28

layer with single table flat table and

play01:32

we call it a logical table so that means

play01:34

we're gonna have two logical tables the

play01:36

first one gonna present three tables

play01:38

after doing the join and the 6 second

play01:41

one can represent two tables using the

play01:43

union but we still have a data modeling

play01:45

to connect those two logical tables and

play01:48

in Tableau we have only one method to do

play01:50

that and we call it relationships and

play01:53

it's very important to understand that

play01:55

in The Logical layer we cannot merge

play01:58

tables in one table so after

play01:59

reconnecting them using the relationship

play02:02

between the two logical tables the table

play02:04

is going to stay as it is and nothing

play02:06

can be merged we just described the

play02:08

relationship between the two logical

play02:10

tables and now back to those two layers

play02:12

both of the physical layer and The

play02:14

Logical layer we can find it inside

play02:15

Tableau Data source and as you know on

play02:18

top of the data source we have our

play02:20

visualizations and you can see in this

play02:22

example only the tables from The Logical

play02:24

layer and you can start building your

play02:26

visualizations using the data available

play02:28

from The Logical layer but sometimes as

play02:31

you are working with the projects you

play02:32

build another data source with another

play02:35

data model and here in this example it's

play02:37

important to understand that that's not

play02:39

all logical tables comes from the

play02:41

physical tables they could come directly

play02:43

from your Source system and now in order

play02:45

to build one visualizations from both of

play02:48

the data models and the data sources we

play02:50

have somehow to connect those two data

play02:53

models or data sources and we can do

play02:55

that in the visualization level where

play02:56

Tableau offer us the last and very

play02:59

unique method of connecting and

play03:01

combining tables something called Data

play03:03

blending so by looking at this you can

play03:05

see that Tableau offer us four different

play03:07

methods of how to combine and connect

play03:09

tables in different layers and different

play03:12

levels so in the physical layer we have

play03:14

the joins and unions we have in the

play03:16

logical layer the relationships and add

play03:18

the visualization level we have data

play03:21

blending

play03:22

foreign

play03:26

how we can navigate through the physical

play03:28

and The Logical layer we are currently

play03:31

at the data source page and as a default

play03:33

we're gonna be at The Logical layer in

play03:35

the data model so that means anything

play03:37

that we drag and drop in our data model

play03:39

gonna be considered as a logical table

play03:42

so the customers is a logical table

play03:44

let's take another one let's take the

play03:46

orders drag and drop it over here so

play03:48

this is our second logical table and as

play03:51

you can see Tablo did create between

play03:52

them a relationship because at the

play03:55

logical layer we can do only

play03:56

relationships so now we are at The

play03:58

Logical layer how we can go to the

play04:00

physical layer in order to do that we're

play04:02

gonna go inside a logical table so let's

play04:05

go to the customers and double click on

play04:07

it once we do that we're gonna go to the

play04:10

second layer we are inside the physical

play04:12

layer now so Tableau can tell you over

play04:14

here the customers is made of one table

play04:17

because we have only one physical table

play04:19

so now anything that we drag and drop in

play04:22

the data model going to be considered as

play04:24

a physical table so for example we can

play04:26

take the customer details let's drag and

play04:29

drop it over here and by default Tablo

play04:31

going to create between them not a

play04:32

relationship it's going to create a join

play04:35

between those two physical tables and of

play04:37

course we can do a union between them so

play04:39

in the physical layer we can do joins

play04:41

and unions and as you can read over here

play04:43

it says the customers The Logical table

play04:46

customers is made of two physical tables

play04:49

and if you hover on this icon you will

play04:51

see exactly that so we have two physical

play04:53

tables defines the logical table

play04:56

customers and now if you want to go up

play04:58

back to the logical layer we can do that

play05:00

by just closing the physical layer so

play05:03

let's click on that and now you can see

play05:05

that the customers has a new icon it

play05:07

says in the physical layer there is like

play05:10

a join and we get more informations if

play05:12

we hover on the tables it says logical

play05:14

table customers that is made of two

play05:16

physical tables the customers and the

play05:19

customers details so that means the data

play05:21

and The Logical tables comes from the

play05:23

physical player but if we go to the

play05:25

orders over here you will see no

play05:27

physical tables the data comes directly

play05:29

from the original tables and with that

play05:31

we have learned how to navigate through

play05:33

the physical and The Logical layer

play05:34

alright so with that we have learned the

play05:36

data moduling in Tableau and what is the

play05:39

physical and logical layers next we will

play05:42

start learning how to combine tables in

play05:44

Tableau and we will start with joins and

play05:47

if you like my content and you want to

play05:49

support the channel then I really

play05:50

appreciate it if you support like and

play05:52

comment it's really going to help the

play05:53

YouTube algorithm thank you so much for

play05:55

watching and I will see you in the next

play05:57

video bye

play05:58

foreign

Rate This

5.0 / 5 (0 votes)

関連タグ
TableauData ModelingLogical LayerPhysical LayerJoinsUnionsRelationshipsData BlendingVisualizationBusiness Analytics
英語で要約が必要ですか?