CPT Simulacijski način rada eng v3
Summary
TLDRThis video provides an introduction to the Packet Tracer simulation environment, explaining the differences between real-time and simulation modes. It covers how to control and observe network traffic, manage time progression, and interact with tools like the simulation panel, packet filters, and complex PDUs. The video also explores advanced features such as creating multiple scenarios, editing PDUs, and viewing packet details. Additionally, it demonstrates how to use the challenge mode to test your understanding of the OSI model, making it a valuable resource for networking learners.
Takeaways
- 🕰️ In real-time mode, the time runs continuously, while in simulation mode, time can be stopped, slowed down, or controlled manually.
- 🔍 The simulation panel allows users to monitor network traffic, viewing one packet at a time.
- ⏯️ The forward, play, and back buttons control the movement of packets within the simulation panel step-by-step or automatically.
- 🔄 Power cycling restarts all devices, clearing the event list and requiring configurations to be saved beforehand.
- ⚡ The animation speed in simulation mode can be adjusted using a slider, affecting how fast packets are forwarded.
- ⏲️ The constant delay feature ensures consistent transmission and propagation times, which can be toggled off for variable delays.
- 📊 The edit filter option allows users to choose which protocols are visible in the simulation panel without removing them from the network.
- 🌐 Users can create ACL filters to control the visibility of specific packet types, such as permitting or excluding protocols.
- 💻 The complex PDU feature allows detailed control over packet creation, including source, destination, sequence numbers, and size.
- 🧑🏫 The OSI model tab in the PDU information window helps users understand how packets are processed at each network layer.
Q & A
What is the difference between real-time mode and simulation mode in Packet Tracer?
-In real-time mode, time runs continuously, and the network functions as it would in reality. In simulation mode, time is stopped and can be controlled by the user to observe network traffic in detail, packet by packet.
How do you control the speed of a simulation in Packet Tracer?
-The speed of a simulation can be controlled using the slider in the simulation mode. Dragging the slider to the right speeds up the simulation, while dragging it to the left slows it down.
What happens when the 'Power Cycle devices' option is selected?
-When the 'Power Cycle devices' option is selected, all devices in the network are restarted, and the event list is cleared. It's important to save any running configurations to avoid losing unsaved changes.
What is the purpose of the 'Edit Filter' in Packet Tracer?
-The 'Edit Filter' allows users to control which protocol events are visible in the simulation panel. Disabling a protocol in the filter does not stop it from propagating on the network, but it hides it from view.
What does the 'constant delay' option do in Packet Tracer?
-When 'constant delay' is enabled, the transmission and propagation delay between packets is kept consistent. Disabling it allows for varying delays between packets.
What is the 'user created packet window' used for?
-The 'user created packet window' allows users to view and manage scenarios where they have created specific packets for testing. It also enables the creation of multiple scenarios without losing previous ones.
What is the purpose of creating a complex PDU in Packet Tracer?
-A complex PDU allows for detailed customization of packet transmission, including defining the packet's size, time-to-live (TTL), sequence number, and the interval at which the packet is sent.
What does the 'Type of Service' field represent in the IP header?
-The 'Type of Service' field in the IP header represents the quality of service (QoS) for the packet, indicating how the packet should be handled in terms of priority across the network.
How does the 'challenge mode' in Packet Tracer help users?
-The 'challenge mode' tests the user's understanding of the OSI model by asking questions about each layer. It provides hints and immediate feedback on correct and incorrect answers.
What happens when you 'reset devices' in Packet Tracer?
-When devices are reset, the simulation starts from scratch, clearing the event list and reinitializing network services like HTTP. It's important to save configurations before resetting.
Outlines

このセクションは有料ユーザー限定です。 アクセスするには、アップグレードをお願いします。
今すぐアップグレードMindmap

このセクションは有料ユーザー限定です。 アクセスするには、アップグレードをお願いします。
今すぐアップグレードKeywords

このセクションは有料ユーザー限定です。 アクセスするには、アップグレードをお願いします。
今すぐアップグレードHighlights

このセクションは有料ユーザー限定です。 アクセスするには、アップグレードをお願いします。
今すぐアップグレードTranscripts

このセクションは有料ユーザー限定です。 アクセスするには、アップグレードをお願いします。
今すぐアップグレード関連動画をさらに表示

Cisco Packet Tracer korisničko sučelje - Eng
Tutorial - Cara Download & Install Cisco Packet Tracer pada Windows 10
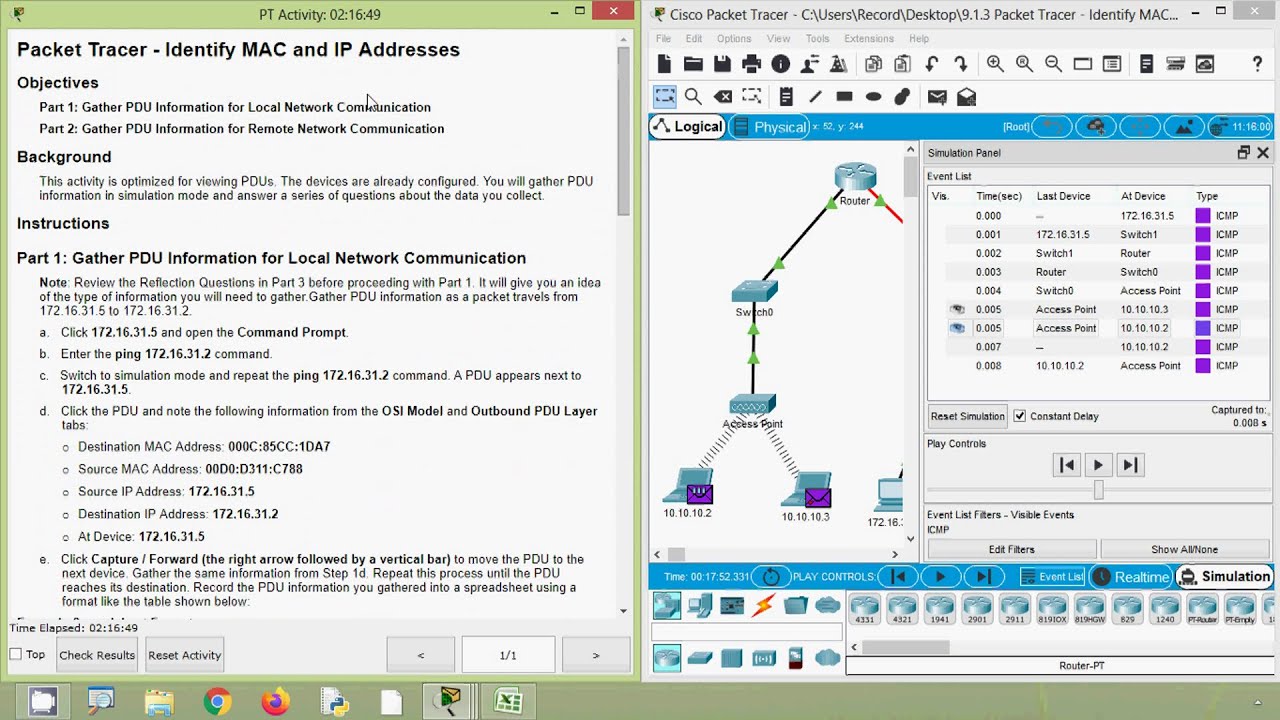
9.1.3 Packet Tracer - Identify MAC and IP Addresses
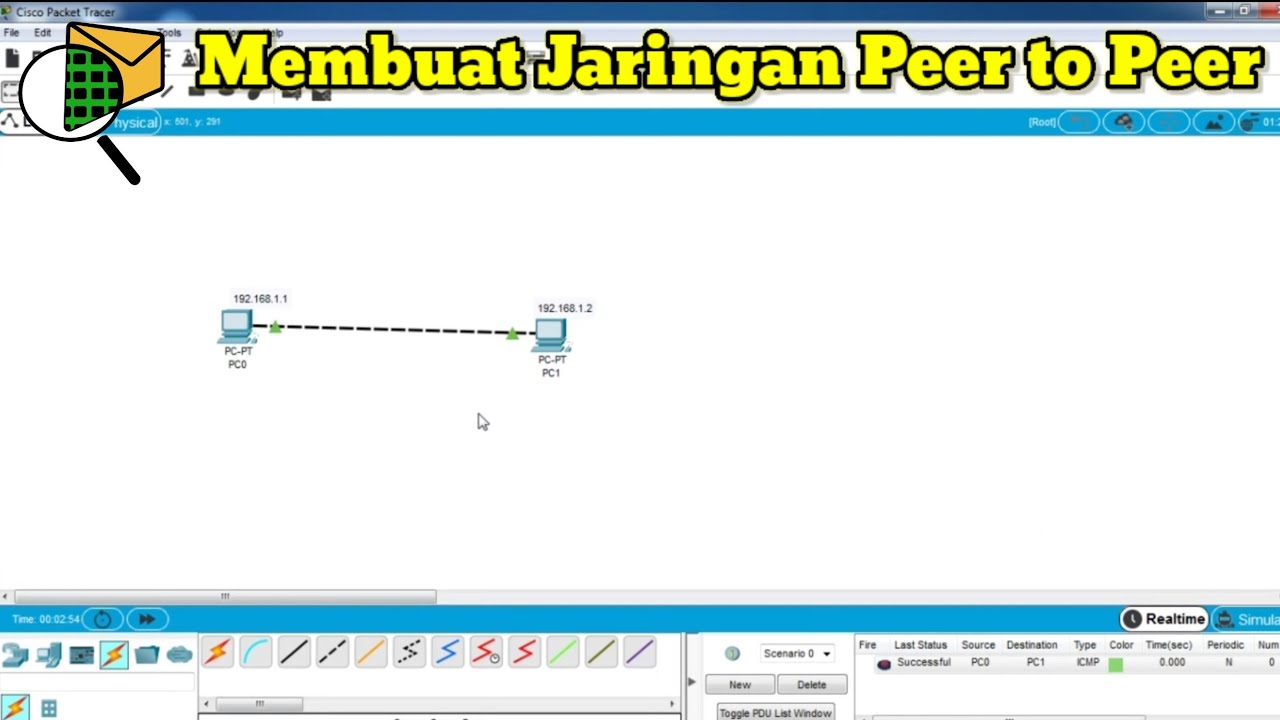
Cara Membuat Jaringan Peer To Peer di Cisco Packet Tracer

Download dan Instal Cisco Packet Tracer | Tutorial Belajar Online Lengkap CISCO CCNA 200-301 Part 4
Getting Started in Cisco Packet Tracer - 2023
5.0 / 5 (0 votes)
