Lec 46 - Exponential Functions: Graphing
Summary
TLDRThis educational video script explores the properties of exponential functions, particularly focusing on functions of the form f(x) = a^x. It discusses the domain, range, intercepts, and end behavior of these functions, highlighting that for a > 1, the function is always increasing with no x-intercept, and for 0 < a < 1, it is decreasing. The script also emphasizes the importance of understanding the graphical behavior of exponential functions without relying solely on visual aids, and concludes with a summary table differentiating the characteristics of exponential functions based on the value of 'a'.
Takeaways
- 📚 The script discusses the properties of exponential functions, specifically focusing on functions of the form f(x) = a^x.
- 🔍 When 'a' is greater than 1, the domain of the function is the entire real line, and the range is from 0 to infinity.
- 📈 For a > 1, the function is always increasing and never touches the x-axis, meaning there is no x-intercept.
- 📉 When 0 < a < 1, the function is decreasing, and the end behavior is that as x approaches infinity, f(x) approaches 0, and as x approaches negative infinity, f(x) approaches infinity.
- 📍 The y-intercept for both cases (a > 1 and 0 < a < 1) is (0, 1), as a^0 equals 1 for any a.
- 🚫 There are no roots for exponential functions where a > 0, as the function never crosses or touches the x-axis.
- 💡 The horizontal asymptote for all such exponential functions is y = 0, indicating the behavior as x approaches infinity or negative infinity.
- 📊 The script introduces the concept of graphing exponential functions without the need for a graphing tool by understanding their properties.
- 🤓 The behavior of the function changes based on the value of 'a', and understanding this allows for predicting the shape and behavior of the graph.
- 🔑 The script uses specific examples, such as f(x) = 2^x and g(x) = 5^(-x), to illustrate the general properties of exponential functions.
- 📈📉 The reflection of the graph across the y-axis (by replacing x with -x) results in a change from an increasing to a decreasing function and vice versa.
Q & A
What is the domain of the function f(x) = 2^x?
-The domain of the function f(x) = 2^x is the entire real line, as it is defined for all real values of x.
What is the range of the function f(x) = 2^x?
-The range of the function f(x) = 2^x is from 0 to infinity (0 to ∞), since 2^x is always positive and never reaches 0.
Does the function f(x) = 2^x have any x-intercepts?
-No, the function f(x) = 2^x does not have any x-intercepts because it never touches the x-axis, as it is always greater than 0.
What is the y-intercept of the function f(x) = 2^x?
-The y-intercept of the function f(x) = 2^x is at the point (0, 1), which occurs when x = 0.
What is the end behavior of the function f(x) = 2^x as x approaches infinity?
-As x approaches infinity, the function f(x) = 2^x also tends to infinity because the exponential growth rate is faster than linear growth.
What is the end behavior of the function f(x) = 2^x as x approaches negative infinity?
-As x approaches negative infinity, the function f(x) = 2^x approaches 0, but never actually reaches it, due to the horizontal asymptote at y = 0.
Are there any roots for the function f(x) = 2^x?
-No, there are no roots for the function f(x) = 2^x because it never crosses or touches the x-axis.
Is the function f(x) = 2^x increasing or decreasing throughout its domain?
-The function f(x) = 2^x is increasing throughout its domain because for any x1 < x2, 2^x1 < 2^x2.
What happens when the base 'a' of the exponential function f(x) = a^x is greater than 1?
-When the base 'a' is greater than 1, the function f(x) = a^x has similar properties to f(x) = 2^x: it is increasing, has no x-intercepts, and has a horizontal asymptote at y = 0.
What is the effect on the graph of the function when x is replaced with -x in an exponential function?
-Replacing x with -x in an exponential function reflects the graph across the y-axis, changing the increasing function to a decreasing one and vice versa.
What is the general behavior of the graph of f(x) = a^x when 0 < a < 1?
-When 0 < a < 1, the graph of f(x) = a^x is a decreasing function with the same domain and range as when a > 1, but with a horizontal asymptote at y = 0 and tending to infinity as x approaches negative infinity.
Outlines

Cette section est réservée aux utilisateurs payants. Améliorez votre compte pour accéder à cette section.
Améliorer maintenantMindmap

Cette section est réservée aux utilisateurs payants. Améliorez votre compte pour accéder à cette section.
Améliorer maintenantKeywords

Cette section est réservée aux utilisateurs payants. Améliorez votre compte pour accéder à cette section.
Améliorer maintenantHighlights

Cette section est réservée aux utilisateurs payants. Améliorez votre compte pour accéder à cette section.
Améliorer maintenantTranscripts

Cette section est réservée aux utilisateurs payants. Améliorez votre compte pour accéder à cette section.
Améliorer maintenantVoir Plus de Vidéos Connexes

Lec 52 - Logarithmic Functions
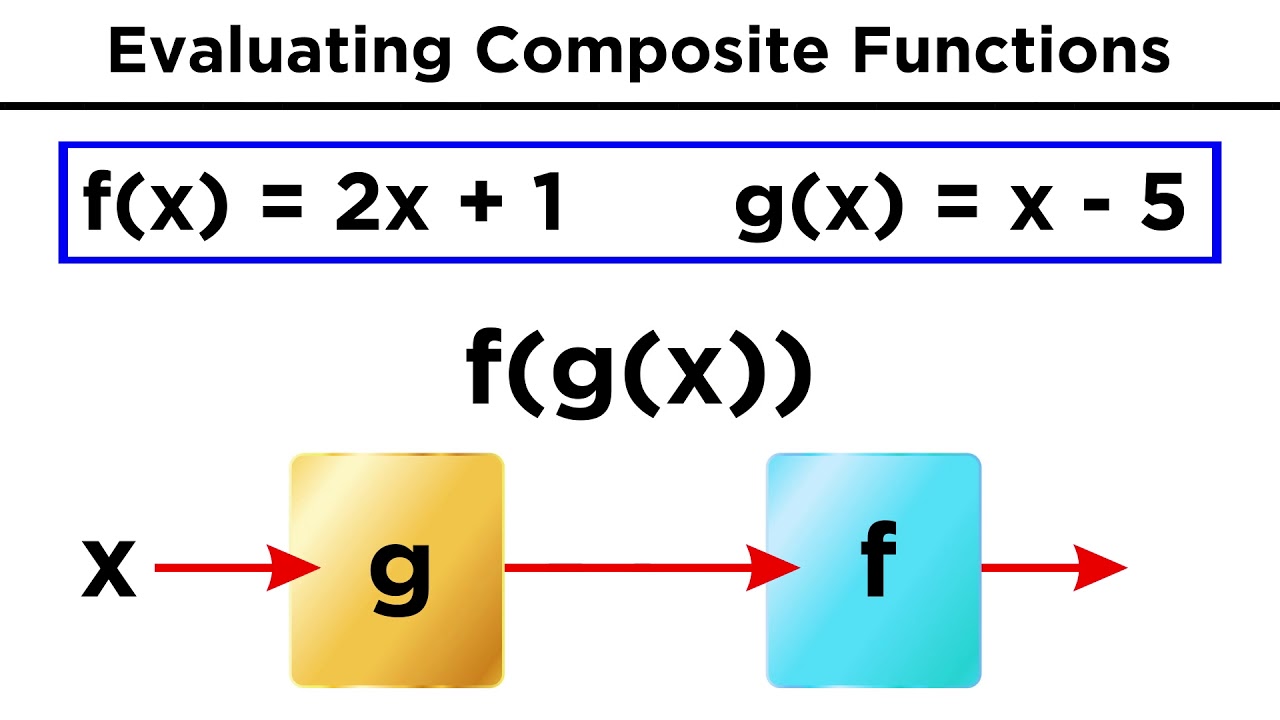
Manipulating Functions Algebraically and Evaluating Composite Functions
Definition of the Derivative
Verifying inverse functions by composition | Mathematics III | High School Math | Khan Academy
Composition of Functions - Grade 11 - General Mathematics

Inverse of One-to-One Function | Grade 11- General Mathematics
5.0 / 5 (0 votes)
