NVDA Stock - Very Important Levels To Watch!
Summary
TLDRIn this Nvidia daily update, the host provides an in-depth technical analysis of Nvidia's stock movements. While Nvidia saw a modest 2% gain, the stock is forming a bullish pattern, particularly a pennant, which could lead to a breakout above key resistance levels, particularly around $181. The video also highlights the importance of key support levels and avoiding market traps, using examples from Nvidia and Netflix. The host emphasizes the need for patience, proper risk management, and watching key levels for potential price action. The broader market analysis remains bullish, despite some bearish divergences.
Takeaways
- 😀 Nvidia is having a relatively slow but constructive day, with a 2% increase, but the stock's direction is still uncertain.
- 😀 The YouTuber offers a private membership section where daily updates, options flow, and technical analysis are shared.
- 😀 Nvidia's chart is setting up with a bullish head and shoulders pattern, indicating a potential upward movement if certain levels are broken.
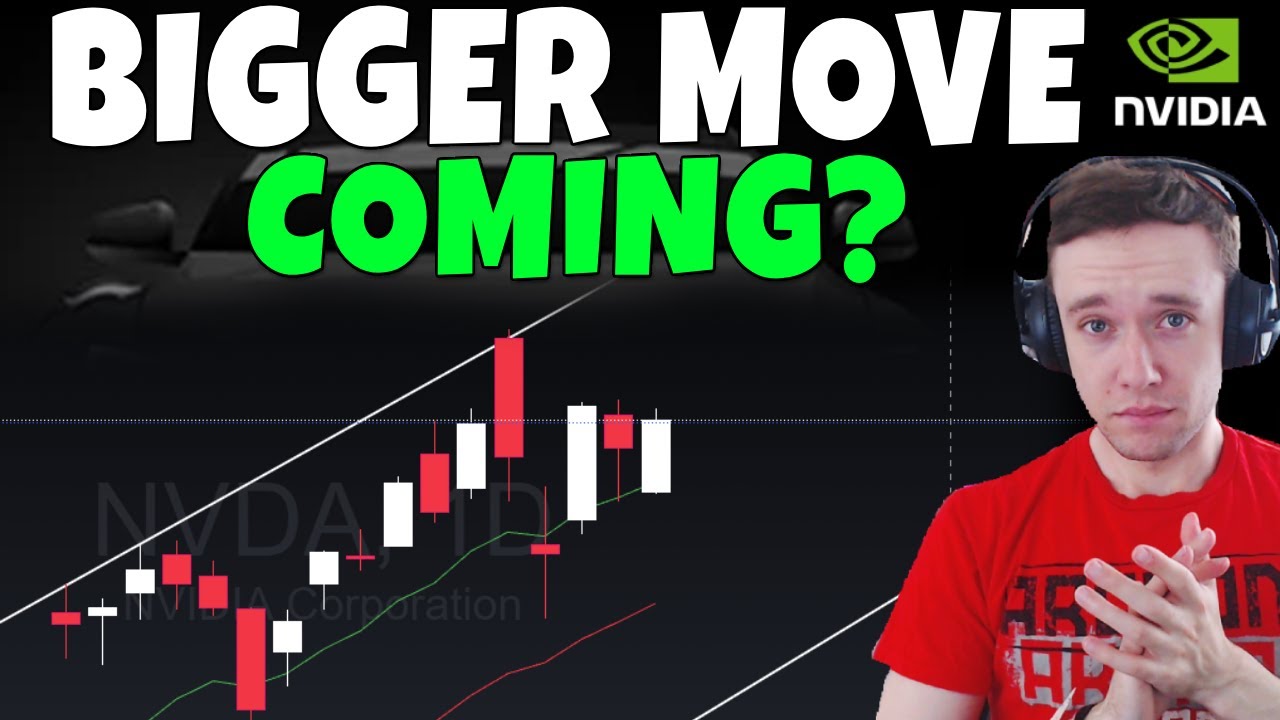
- 😀 A breakout above the current pennant formation could push Nvidia stock to test key resistance at $181, potentially leading to all-time highs.
- 😀 If Nvidia fails to hold the pennant and closes below key support levels like $169–$170, it could lead to a price drop towards $150.
- 😀 The importance of avoiding being 'liquidity' in the market is stressed, highlighting the risks of stop losses being triggered and causing price reversals.
- 😀 Examples of liquidity sweeps in Netflix and Hood are mentioned, where price movements caused stop losses to trigger, only for the market to reverse higher.
- 😀 Patience is key in trading; waiting for daily closures above key levels ensures a more reliable trading strategy.
- 😀 The broader market (Q's) remains bullish, but concerns over a bearish divergence in MACD and an upcoming weaker period in September are mentioned.
- 😀 While the market's trend is still considered bullish, the YouTuber is hedging against potential downturns by investing in Berkshire Hathaway, which is cash-heavy.
- 😀 The script concludes with a reminder to monitor key levels on both the Q's and SPY for any potential signs of reversal, especially given the upcoming weak period in the market.
Q & A
What was Nvidia's stock performance on the day discussed in the video?
-Nvidia gained about 2% on the day, marking a modest but constructive movement after a brief pop and partial retracement.
Which technical pattern did the speaker identify for Nvidia?
-The speaker identified a bullish head and shoulders pattern followed by the formation of a bullish pennant, indicating potential continuation of the uptrend.
What is the key resistance level Nvidia needs to break to shift to a bullish structure?
-The key resistance level is around $181, corresponding to a green Fibonacci level, which the bulls need to break for a potential higher high.
What are the primary support levels to watch for Nvidia?
-Support levels include the EMA 9/21 around $174–175 and a trendline near $170. Breaking below $169–170 could lead to a further decline toward $150.
Why does the speaker emphasize daily candle closures rather than intraday price movements?
-Daily closures confirm trends more reliably and help traders avoid becoming liquidity for market reversals caused by stop-loss triggers.
What is a liquidity sweep, and how does it affect trading decisions?
-A liquidity sweep occurs when the market triggers stop-loss orders at key levels before reversing. Traders should wait for confirmation to avoid being caught in these reversals.
How does the speaker interpret Nvidia's trading volume?
-Higher volume in recent days is seen as positive for the bulls, indicating potential buildup for a significant breakout if key levels are surpassed.
What broader market trends were discussed in relation to SPY and QQQ?
-The broader market is largely bullish, though there are some bearish divergences in the MACD. Key levels for SPY include EMA 9 at ~590, EMA 21 at ~580, and support zones down to 540.
How is Berkshire Hathaway (BRK.B) used in the context of market hedging?
-BRK.B is used as a hedge against potential market downturns because its heavy cash position makes it resilient, providing a protective play if broader indices pull back.
What is the speaker's outlook for Nvidia and the broader market in the near term?
-Nvidia is bullish if key resistance is broken, but traders must watch support levels carefully. The broader market remains bullish with no immediate bearish signs, though historically weak periods in late September warrant caution.
What subscription options does the speaker offer for in-depth updates?
-Three tiers are offered: $3/month for Tesla and broader market updates, $5/month adds Nvidia updates, and $7/month includes all other stock updates, including minor tickers and setups.
Outlines

Cette section est réservée aux utilisateurs payants. Améliorez votre compte pour accéder à cette section.
Améliorer maintenantMindmap

Cette section est réservée aux utilisateurs payants. Améliorez votre compte pour accéder à cette section.
Améliorer maintenantKeywords

Cette section est réservée aux utilisateurs payants. Améliorez votre compte pour accéder à cette section.
Améliorer maintenantHighlights

Cette section est réservée aux utilisateurs payants. Améliorez votre compte pour accéder à cette section.
Améliorer maintenantTranscripts

Cette section est réservée aux utilisateurs payants. Améliorez votre compte pour accéder à cette section.
Améliorer maintenant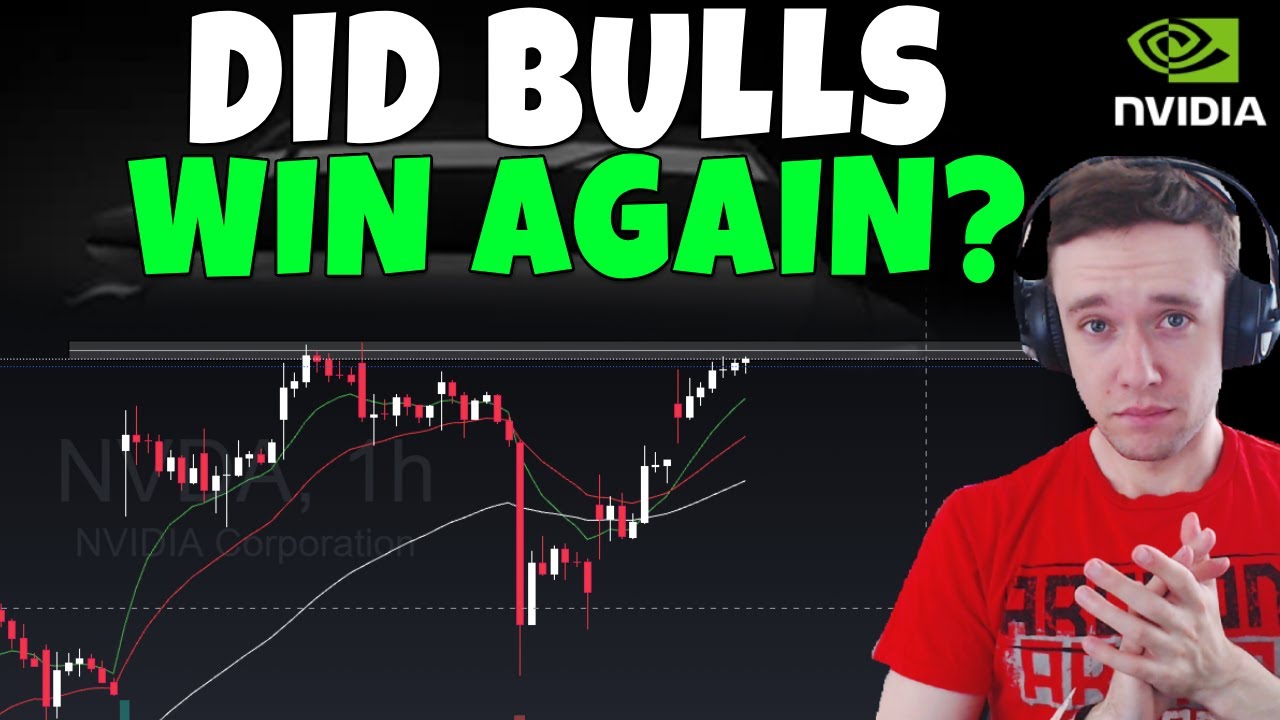


5.0 / 5 (0 votes)
