Statistika: Uji Korelasi-Regresi sederhana menggunakan SPSS
Summary
TLDRIn this educational video, the instructor introduces simple linear regression and correlation testing using SPSS. The tutorial covers key steps, including defining variables, inputting data, and running regression analysis in SPSS. It emphasizes the importance of assumption tests such as normality, autocorrelation, and heteroscedasticity to ensure valid results. The video also explains how to interpret SPSS outputs, including model fit, significance testing, and the regression equation. The session concludes by guiding students on how to interpret statistical findings, offering valuable insights for conducting accurate regression analysis.
Takeaways
- 😀 The lesson focuses on simple regression and correlation analysis using SPSS.
- 😀 In this session, SPSS is introduced as a tool to simplify regression and correlation calculations.
- 😀 The independent variable (X) is production cost, and the dependent variable (Y) is sales in the example provided.
- 😀 To input data, the 'Variable View' and 'Data View' in SPSS are used, ensuring correct definition of variables and data formatting.
- 😀 Data types such as numeric, string, and scale are explained for setting up variables correctly in SPSS.
- 😀 The analysis process involves selecting 'Analyze' > 'Regression' > 'Linear', followed by inputting the dependent and independent variables.
- 😀 Various statistics and plots, such as normality, collinearity, and residuals, are selected to check model assumptions.
- 😀 Assumption tests include normality, autocorrelation, and heteroscedasticity, which must be satisfied for accurate regression analysis.
- 😀 The Durbin-Watson test is used to check for autocorrelation in the residuals, with a specific range indicating the presence or absence of autocorrelation.
- 😀 Heteroscedasticity is checked using graphical methods, looking for any patterns in the residuals that would indicate unequal variance.
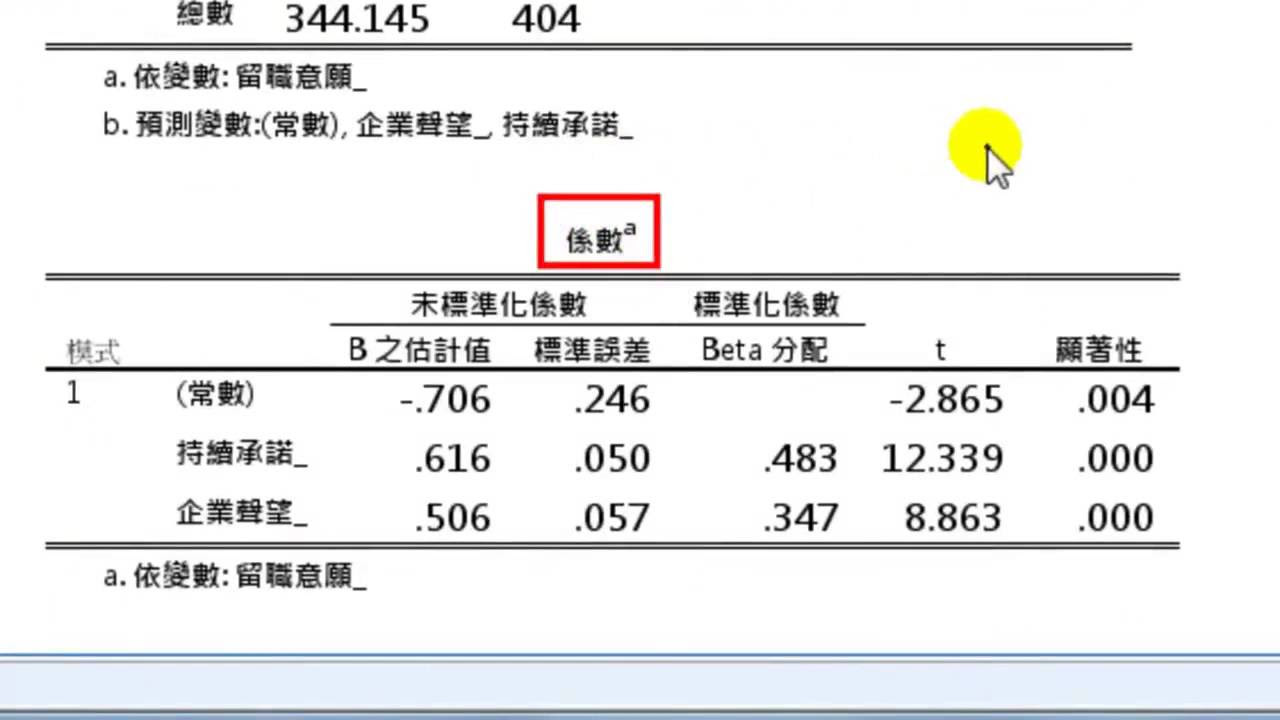
- 😀 Significance testing is done by comparing the p-value with a significance level (0.05). If the p-value is less than 0.05, the independent variable significantly impacts the dependent variable.
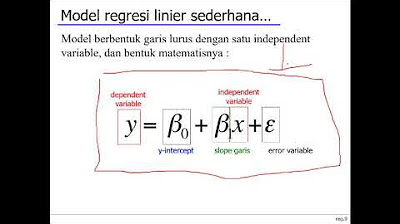
- 😀 The regression equation and the coefficient of determination (R²) help interpret the relationship between variables, indicating the proportion of variance explained by the independent variable.
Q & A
What is the purpose of the session discussed in the transcript?
-The session focuses on teaching how to perform simple regression and correlation tests using SPSS, covering data input, assumption tests, and interpreting the results.
What is the first step in using SPSS for regression analysis?
-The first step is to define and input the data into SPSS. In the Variable View, you need to define variables like 'X' for production cost and 'Y' for sales, ensuring that the data is numeric and properly formatted.
Why is it important to define variables correctly in SPSS?
-Defining variables correctly ensures that the data is properly interpreted by SPSS, particularly making sure that numeric data is not mistakenly treated as text and that the scale is set correctly (e.g., cardinal, ordinal, or nominal).
What does the 'Analyze' function do in SPSS for regression analysis?
-The 'Analyze' function allows you to perform regression analysis. By selecting 'Regression' and then 'Linear', you can input independent and dependent variables to run the analysis.
What assumptions must be tested before performing a regression analysis?
-Before performing regression analysis, it is crucial to test assumptions like normality of residuals, autocorrelation, and heteroskedasticity. These ensure that the regression model is valid and reliable.
How is the normality of residuals tested in SPSS?
-The normality of residuals is tested using a Normal Probability Plot or histogram. If the data points follow the diagonal line closely, it indicates that the residuals are normally distributed.
What is autocorrelation, and how is it tested in SPSS?
-Autocorrelation refers to the correlation between consecutive observations in a time-series dataset. In SPSS, it is tested using the Durbin-Watson statistic. If the value is significantly different from 2, it indicates autocorrelation.
How do you interpret the Durbin-Watson statistic in regression analysis?
-The Durbin-Watson statistic is used to detect autocorrelation. A value close to 2 suggests no autocorrelation, while values significantly less than or greater than 2 indicate positive or negative autocorrelation, respectively.
What does heteroskedasticity mean, and how is it tested in SPSS?
-Heteroskedasticity refers to the situation where the variance of residuals is not constant across all observations. It is tested visually using scatterplots; if the residuals form a regular pattern (e.g., funnel-shaped), heteroskedasticity is present.
How do you interpret the coefficient of regression (b) in the context of production cost and sales?
-The regression coefficient (b) represents the change in the dependent variable (sales) for a one-unit change in the independent variable (production cost). For example, if b = 0.685, it means that for every unit increase in production cost, sales increase by 0.685 units.
Outlines

Cette section est réservée aux utilisateurs payants. Améliorez votre compte pour accéder à cette section.
Améliorer maintenantMindmap

Cette section est réservée aux utilisateurs payants. Améliorez votre compte pour accéder à cette section.
Améliorer maintenantKeywords

Cette section est réservée aux utilisateurs payants. Améliorez votre compte pour accéder à cette section.
Améliorer maintenantHighlights

Cette section est réservée aux utilisateurs payants. Améliorez votre compte pour accéder à cette section.
Améliorer maintenantTranscripts

Cette section est réservée aux utilisateurs payants. Améliorez votre compte pour accéder à cette section.
Améliorer maintenantVoir Plus de Vidéos Connexes


5.0 / 5 (0 votes)
