一夜。統計學:迴歸分析

Yenku Kuo 郭彥谷
6 Apr 201605:34

Summary

TLDRThis educational script introduces regression analysis, a commonly used technique in master's theses for hypothesis testing. It demonstrates how to utilize SPSS software to perform linear regression, a simple yet powerful method to understand the explanatory or predictive power of independent variables on a dependent variable. The example illustrates the impact of corporate reputation and sustained commitment on job retention willingness. The script guides viewers through the process of setting up a regression model in SPSS, interpreting the output, and focusing on key aspects such as standardized Beta coefficients and R-squared values. It concludes by emphasizing the importance of practice and the adjusted R-squared for a more conservative estimation in reporting.

Takeaways

  • 📚 Regression analysis is a common technique used in master's theses for hypothesis testing.
  • 🔍 The main purpose of regression analysis is to understand the explanatory or predictive power of independent variables on a dependent variable.
  • 📈 The mathematical formula for regression may seem complex, but it becomes simple when using statistical software like SPSS.
  • 💻 SPSS makes it easy to execute regression analysis with a straightforward interface.
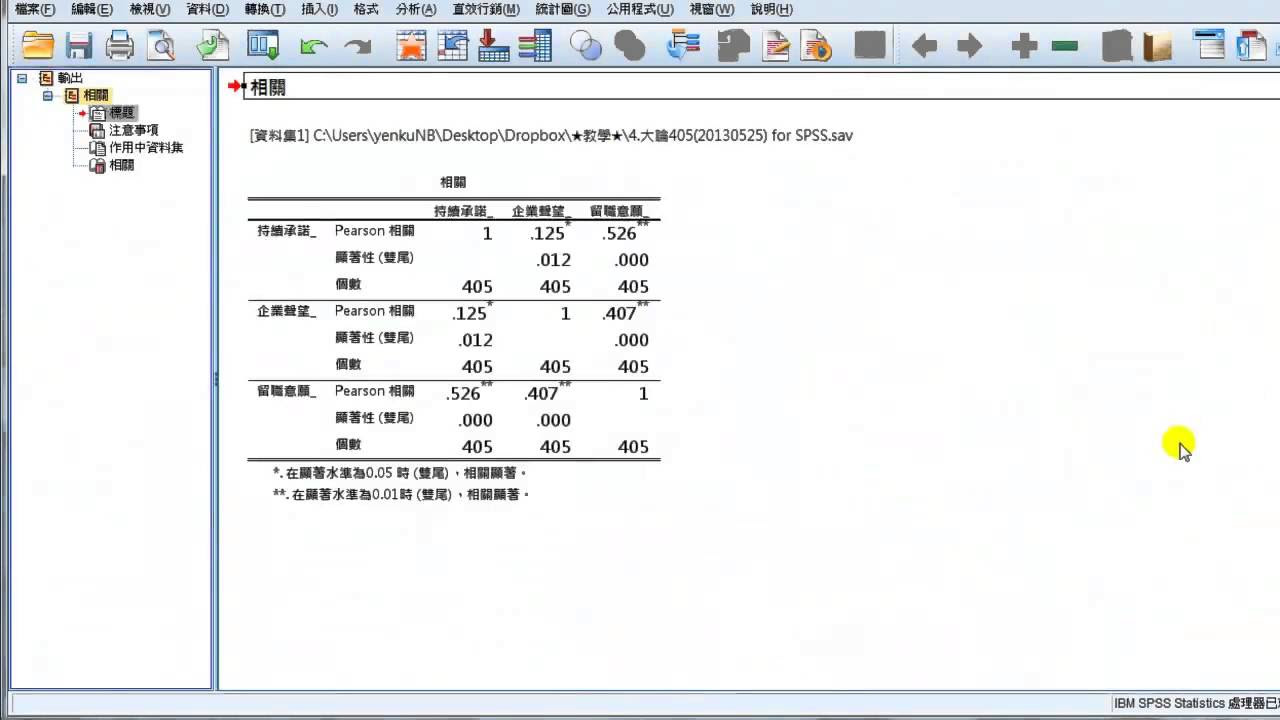
  • 📝 An example in the script illustrates how to analyze the impact of corporate reputation and sustained commitment on job retention willingness.
  • 📊 In SPSS, regression analysis involves selecting independent and dependent variables and running the analysis to obtain results.
  • 📉 The script mentions standardized Beta regression coefficients, which indicate the strength and significance of the relationship between variables.
  • 📐 The example provided shows that sustained commitment has a standardized regression coefficient of 0.483, and corporate reputation has a coefficient of 0.347, both positively influencing job retention willingness and are statistically significant.
  • 🔢 R-squared is a key metric in regression analysis, indicating the proportion of the variance in the dependent variable that is predictable from the independent variables.
  • 📈 In the example, sustained commitment and corporate reputation together explain 39.5% of the variance in job retention willingness.
  • 📝 Adjusted R-squared is recommended for reporting, especially when there are multiple independent variables, as it provides a more conservative estimate of the model's explanatory power.

Q & A

  • What is the purpose of regression analysis in a master's thesis?

    -Regression analysis is commonly used in a master's thesis to test research hypotheses. It helps to understand the explanatory or predictive power of independent variables on a dependent variable.

  • Why is linear regression a preferred method for social science research?

    -Linear regression is preferred in social science research because it provides a simple and straightforward way to model the relationship between variables and is effective for hypothesis testing.

  • How does one execute regression analysis using SPSS software?

    -In SPSS, regression analysis can be executed by selecting the 'Regression' option from the dropdown menu, choosing 'Linear' for the type of regression, and then inputting the independent and dependent variables into the appropriate fields before running the analysis.

  • What are the variables considered in the provided example for regression analysis?

    -In the example, 'corporate reputation' and 'continuous commitment' are the independent variables, while 'job retention intention' is the dependent variable.

  • What is the significance of standardized Beta coefficients in regression analysis?

    -Standardized Beta coefficients indicate the strength and direction of the relationship between each independent variable and the dependent variable. They are crucial for understanding the impact of each independent variable on the dependent variable.

  • What does a positive standardized Beta coefficient of 0.483 for continuous commitment signify in the context of job retention intention?

    -A positive standardized Beta coefficient of 0.483 for continuous commitment indicates that there is a positive relationship between continuous commitment and job retention intention, with continuous commitment having a significant influence on the intention to stay in the job.

  • How much of the variation in job retention intention is explained by corporate reputation and continuous commitment according to the R-squared value?

    -The R-squared value of 0.395 indicates that corporate reputation and continuous commitment together explain 39.5% of the variation in job retention intention.

  • What is the difference between R-squared and adjusted R-squared, and why might one prefer to report the adjusted R-squared in a thesis?

    -While R-squared measures the proportion of variance in the dependent variable that is predictable from the independent variables, adjusted R-squared takes into account the number of predictors in the model and provides a more conservative estimate. It is preferred in a thesis because it adjusts for the potential overestimation due to additional variables.

  • What is the importance of practicing regression analysis for students as suggested in the script?

    -Practicing regression analysis is important for students as it helps them to become proficient in using statistical tools, understand the underlying concepts better, and apply these skills in their research effectively.

  • How does the script guide students to interpret the results of a regression analysis?

    -The script guides students through the process of interpreting regression analysis by focusing on key elements such as standardized Beta coefficients, significance levels, and R-squared values, which are essential for understanding the impact and explanatory power of the independent variables.

Outlines

00:00

📚 Introduction to Regression Analysis

This paragraph introduces regression analysis as a common technique used in master's theses for hypothesis testing. It emphasizes the role of regression in examining the explanatory or predictive power of independent variables on a dependent variable. The speaker simplifies the complex mathematical formula by demonstrating how to use SPSS statistical software for regression analysis. An example is given to illustrate the process of analyzing the impact of corporate reputation and continuous commitment on the dependent variable, which is the intention to stay with a company. The speaker guides the audience through the steps in SPSS, from selecting the regression option to inputting the variables and executing the analysis.

05:04

📈 Key Points in Regression Analysis and Interpretation

This paragraph focuses on the key aspects to consider when interpreting the results of a regression analysis. It discusses the importance of looking at the coefficient table, specifically the standardized Beta regression coefficients, which indicate the strength and significance of the relationship between the independent and dependent variables. The example provided shows that continuous commitment has a positive standardized regression coefficient of 0.483 and corporate reputation has a coefficient of 0.347, both of which are significant. Additionally, the paragraph explains the concept of R-squared, which measures the proportion of variance in the dependent variable that is predictable from the independent variables. The adjusted R-squared is introduced as a more conservative estimate of the model's explanatory power, which is recommended for reporting when there are multiple independent variables.

Mindmap

Keywords

💡Regression Analysis

Regression analysis is a statistical method used to examine the relationship between two or more variables. In the context of the video, it is the primary technique for testing research hypotheses in a master's thesis. The script mentions that regression analysis is used to understand the explanatory or predictive power of independent variables on a dependent variable, such as how corporate reputation and sustained commitment affect the willingness to stay in a job.

💡Independent Variables

Independent variables are the factors that are manipulated or changed in an experiment to determine their effect on the dependent variable. In the script, 'corporate reputation' and 'sustained commitment' are given as examples of independent variables that are being analyzed to see their impact on the dependent variable, which is the 'willingness to stay' in a job.

💡Dependent Variable

A dependent variable is the outcome that is measured in an experiment, and it is thought to be influenced by the independent variables. In the video script, 'willingness to stay' is the dependent variable, which is being examined to see how it is affected by the independent variables of corporate reputation and sustained commitment.

💡Linear Regression

Linear regression is a type of regression analysis that models the relationship between a dependent variable and one or more independent variables by fitting a linear equation to observed data. The script specifically mentions that linear regression is the simplest form of regression equation used in social sciences and is the method chosen to analyze the impact of independent variables on the dependent variable.

💡SPSS

SPSS, or Statistical Package for the Social Sciences, is a software package used for statistical analysis in solving complex data problems. The script describes how SPSS can be used to execute regression analysis, making the process appear simple and straightforward despite the mathematical complexity of regression formulas.

💡Standardized Beta Coefficient

The standardized beta coefficient is a measure of the strength and direction of the relationship between the independent and dependent variables in a regression analysis. In the script, it is mentioned that the standardized regression coefficients for 'sustained commitment' and 'corporate reputation' are 0.483 and 0.347, respectively, indicating their positive influence on the willingness to stay.

💡Significance

In statistical analysis, significance refers to the probability that a result did not occur by chance. The script indicates that the coefficients for both 'sustained commitment' and 'corporate reputation' are significant, meaning that their effects on the willingness to stay are statistically reliable and not due to random chance.

💡R Squared

R squared, or the coefficient of determination, is a statistical measure that represents the proportion of the variance for a dependent variable that's explained by an independent variable or variables in a regression model. The script mentions that 'sustained commitment' and 'corporate reputation' together explain 39.5% of the variance in the willingness to stay, as indicated by the R squared value.

💡Adjusted R Squared

Adjusted R squared is a modified version of R squared that has been adjusted for the number of predictors in the model. It provides a more accurate measure of how well the model fits the data, especially when comparing models with different numbers of predictors. The script suggests reporting the adjusted R squared value for a more conservative estimate of the model's explanatory power.

💡Research Hypothesis

A research hypothesis is a proposed explanation made on the basis of limited evidence as a starting point for further investigation. In the video, it is stated that the research hypotheses written in a thesis are typically tested using regression analysis, which is used to validate or refute the proposed relationships between variables.

Highlights

Regression analysis is commonly used in master's theses for hypothesis testing.

Regression analysis aims to understand the explanatory or predictive power of independent variables on dependent variables.

SPSS software simplifies the execution of regression analysis.

Linear regression is the most commonly used type of regression in social sciences.

The process of conducting regression analysis in SPSS involves selecting independent and dependent variables.

The example demonstrates the impact of corporate reputation and sustained commitment on job retention willingness.

Standardized Beta coefficients indicate the strength and significance of the relationship between variables.

Sustained commitment has a positive and significant standardized regression coefficient of 0.483 on job retention willingness.

Corporate reputation has a positive and significant standardized regression coefficient of 0.347 on job retention willingness.

R-squared measures the proportion of variance in the dependent variable that is predictable from the independent variables.

Combined, sustained commitment and corporate reputation explain 39.5% of the variance in job retention willingness.

Adjusted R-squared provides a more conservative estimate of the model's explanatory power.

Adjusted R-squared is recommended for reporting when there are multiple independent variables.

Practice is encouraged to master the use of regression analysis.

The introduction of regression analysis aims to be helpful for students.

Transcripts

play00:02

親愛的各位同學 我們現在要接著講解迴歸分析

play00:08

迴歸分析大概是一本碩士論文最常使用到的

play00:15

研究假設檢驗技術 所以我們在論文裡面所寫到的研究假設

play00:23

最後大概都會用線性迴歸這件事情來去做處理

play00:30

好 那迴歸分析主要是想要知道自變項

play00:36

對於依變項的解釋力 或者是預測力

play00:41

我們從這個數學公式來看 好像也是有一點複雜

play00:47

不過我們如果用spss統計軟體

play00:52

來執行的時候 你會發現它其實非常的簡單

play00:57

好 我們來看一下我們spss教學檔案

play01:03

一樣 我們用一個例子來做說明 假設我今天想要知道

play01:11

企業聲望還有持續承諾這兩個自變數

play01:19

對於 留職意願 y 有怎麼樣的影響力 那我們要怎麼樣去執行呢

play01:30

好 我們現在一樣 用起手式分析 按下去之後你看到這個下拉式的選單

play01:39

很清楚的可以看到迴歸

play01:43

好 那這個迴歸其實非常的多種

play01:47

不過 一般來說 我們的社會科學所使用到的是線性迴歸

play01:55

最簡單的一種迴歸方程式

play01:59

我們點選了以後 他出現這樣的一個工作視窗啊 跟各位同學說明一下

play02:06

簡單的迴歸 它其實非常的單純 它這邊有寫到一個叫做自變數independent

play02:13

上面有一個依變數dependent

play02:21

也就是說 把你剛才研究的問題所謂的自變數

play02:28

還有依變數分別選進來 那幾乎就已經大功告成了

play02:36

好 我們現在來做一次 我們剛才所說的是把企業聲望

play02:43

還有 持續承諾當做自變數

play02:53

所以我們把自變數選取起來

play02:56

再來 我們選取留職意願當做我們的依變數

play03:04

按照我們的定義分別擺放在正確的位置之後我們就可以按下確定 讓電腦幫我們執行迴歸分析

play03:16

接著我們來看一下統計報表的輸出

play03:20

這個時候他的迴歸已經做完了

play03:26

好 這個迴歸分析來教大家看一下該注意的地方

play03:33

首先 我們先看一下 最下面有一張叫做係數表

play03:39

這個係數表呢 我們可以看一下它的標準化Beta迴歸係數

play03:47

所以你可以發現

play03:49

持續承諾對於留職意願的標準化迴歸係數是0.483 它是正的

play03:59

而且它有達到顯著性

play04:03

然後 企業聲望對於留職意願的標準化迴歸係數是

play04:10

0.347也是正的 而且有顯著性

play04:17

所以我們的迴歸分析基本上是完成了

play04:22

那我們還有一個地方要去注重的 也就是R平方 你可以看到上面有一個是R平方

play04:32

R平方指的是

play04:34

自變數能夠解釋依變數的變異量 我們就可以說 持續承諾

play04:42

還有企業聲望這兩個變數 共同解釋了留職意願39.5%的一個變異量

play04:53

我們一般在報告的時候 如果有兩個自變數

play04:58

建議各位同學可以報告這個 調整後的R平方

play05:04

調整後的R平方 會比

play05:07

R平方 稍微小一點點 它是一個比較保守估計的數值 所以可以

play05:15

報告 調整後的R平方

play05:19

好 這就是有關於我們迴歸分析的一個介紹

play05:25

那希望各位同學能夠多加練習 那 以上希望對你們有幫助 謝謝

Rate This

5.0 / 5 (0 votes)

Related Tags
Regression AnalysisSPSS SoftwareHypothesis TestingVariable PredictionSocial ScienceResearch MethodLinear RegressionStatistical AnalysisIndependent VariablesDependent Variables