(1/4) Analisis Regresi : Uji asumsi Klasik
Summary
TLDRThis video discusses linear regression analysis in depth, building on a previous introduction to the topic using Excel. The speaker explains the difference between correlation and regression, focusing on simple linear regression (one independent variable) and multiple linear regression (several independent variables). The speaker also introduces key assumptions needed for multiple regression analysis, such as normality, linearity, and the absence of multicollinearity, autocorrelation, and heteroscedasticity. The example of analyzing the effect of income, lifestyle, and education on monthly expenditure is used, along with practical steps for using SPSS to conduct these analyses.
Takeaways
- 📊 Regression analysis is used to determine relationships and the strength of those relationships between variables.
- 🔗 Correlation analysis looks at the presence and strength of a relationship, while regression analysis determines whether one variable influences another.
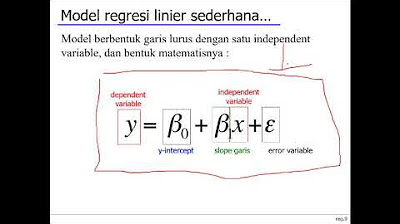
- 🧑🏫 In simple linear regression, there is one independent variable (X) and one dependent variable (Y), such as income (X) affecting lifestyle (Y).
- 👨💻 Multiple linear regression involves multiple independent variables (X1, X2, etc.) affecting a dependent variable (Y), for example, income, lifestyle, and education affecting monthly expenses.
- 📝 In research, simple linear regression is less common compared to multiple regression, where at least two independent variables are used.
- 🛠️ When conducting multiple regression, several assumptions must be met: normal distribution of data, linearity, absence of multicollinearity, absence of autocorrelation, and no heteroscedasticity.
- 📉 Multicollinearity occurs when independent variables influence each other, and must be avoided in regression analysis.
- 📈 Autocorrelation refers to a situation where data points in time series affect each other, which should be absent in regression data.
- 🔬 Heteroscedasticity happens when the variance of errors differs across observations, and it should be avoided to ensure regression model efficiency.
- 🛠️ Common tools like SPSS are recommended for performing multiple regression analysis, as it simplifies complex calculations and testing for the required assumptions.
Q & A
What is the main difference between correlation analysis and regression analysis?
-Correlation analysis examines the existence and strength of relationships between variables, while regression analysis determines if one variable affects another and how much influence it has.
What distinguishes simple linear regression from multiple linear regression?
-Simple linear regression involves one independent variable (X) and one dependent variable (Y), whereas multiple linear regression includes more than one independent variable affecting the dependent variable.
What are the assumptions that need to be checked before performing multiple linear regression?
-Before performing multiple linear regression, the following assumptions must be met: normality of data, linearity, absence of multicollinearity, absence of autocorrelation, and homoscedasticity (absence of heteroscedasticity).
What is multicollinearity and why is it important to avoid it in regression analysis?
-Multicollinearity occurs when independent variables are highly correlated with each other, which can distort the results of regression analysis. It is important to avoid multicollinearity because it makes it difficult to determine the individual effect of each independent variable on the dependent variable.
What is autocorrelation and how can it affect regression analysis?
-Autocorrelation refers to the situation where residuals (errors) in the regression model are correlated with each other. It can lead to biased estimates in regression analysis, particularly when time-series data is used, as the relationship between variables becomes inconsistent over time.
What is heteroscedasticity and how does it affect the regression model?
-Heteroscedasticity occurs when the variance of the residuals or errors is not constant across all levels of the independent variables. It can result in inefficient estimates and affect the reliability of statistical tests within the regression model.
Why is SPSS often preferred for multiple linear regression analysis compared to Excel?
-SPSS is preferred for multiple linear regression analysis over Excel because it offers more robust and comprehensive tools for statistical testing, such as automated assumption checks, faster computation, and more detailed output interpretations.
What are some of the key statistical tests used to validate the assumptions in multiple linear regression?
-Key statistical tests include normality tests (such as Kolmogorov-Smirnov), linearity tests, multicollinearity checks using Variance Inflation Factor (VIF), autocorrelation tests (e.g., Durbin-Watson), and heteroscedasticity checks.
What are partial and simultaneous hypothesis tests in regression analysis?
-Partial hypothesis tests examine the effect of each independent variable individually on the dependent variable. Simultaneous hypothesis tests evaluate the combined effect of all independent variables on the dependent variable.
How is the Durbin-Watson statistic used in regression analysis?
-The Durbin-Watson statistic is used to detect autocorrelation in the residuals of a regression model. A value between 1.5 and 2.5 suggests no significant autocorrelation, while values outside this range indicate potential autocorrelation issues.
Outlines

This section is available to paid users only. Please upgrade to access this part.
Upgrade NowMindmap

This section is available to paid users only. Please upgrade to access this part.
Upgrade NowKeywords

This section is available to paid users only. Please upgrade to access this part.
Upgrade NowHighlights

This section is available to paid users only. Please upgrade to access this part.
Upgrade NowTranscripts

This section is available to paid users only. Please upgrade to access this part.
Upgrade NowBrowse More Related Video

Week 6 Statistika Industri II - Analisis Regresi (part 1)

Praktikum Ekonometrika I P4 - Regresi Linier Berganda

KULIAH STATISTIK - ANALISIS REGRESI

Analisis Korelasi "Nilai Koefisien Korelasi dan Tingkat Korelasi" Part 1 Mtk 11 SMA Kmerdeka

Data Mining 10 - Estimation (Linear Regression)

Using Multiple Regression in Excel for Predictive Analysis
5.0 / 5 (0 votes)