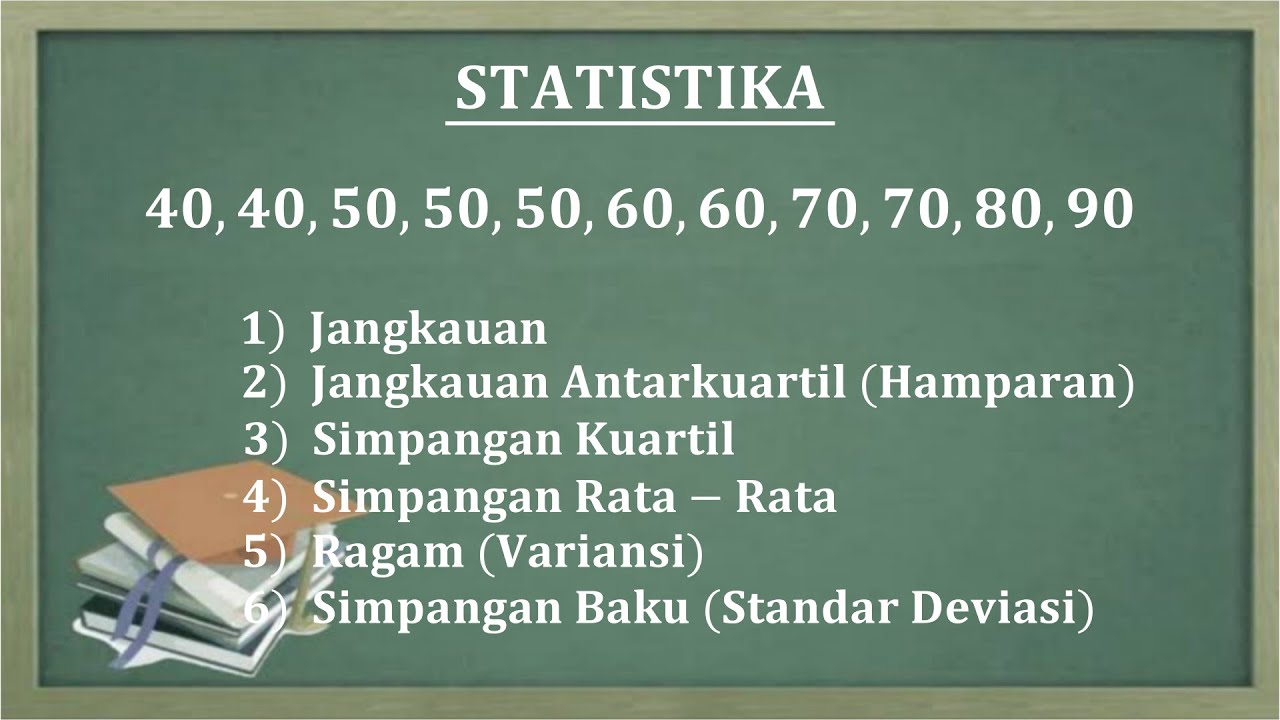
UKURAN PENYEBARAN (DATA TUNGGAL)
Summary
TLDRIn this video, Aida explains various concepts related to the spread of single data sets, including range, interquartile range, quartile deviation, mean deviation, variance, and standard deviation. Through step-by-step examples, she demonstrates how to calculate each measure using practical data, such as the number of family members in a dormitory and the prices of notebooks. Aida breaks down complex calculations and provides visual aids to make it easier for viewers to understand, offering viewers clear insights into data distribution and statistical measures.
Takeaways
- 😀 The script covers the topic of measures of data spread, focusing on single data sets and several statistical concepts like range, interquartile range, mean deviation, variance, and standard deviation.
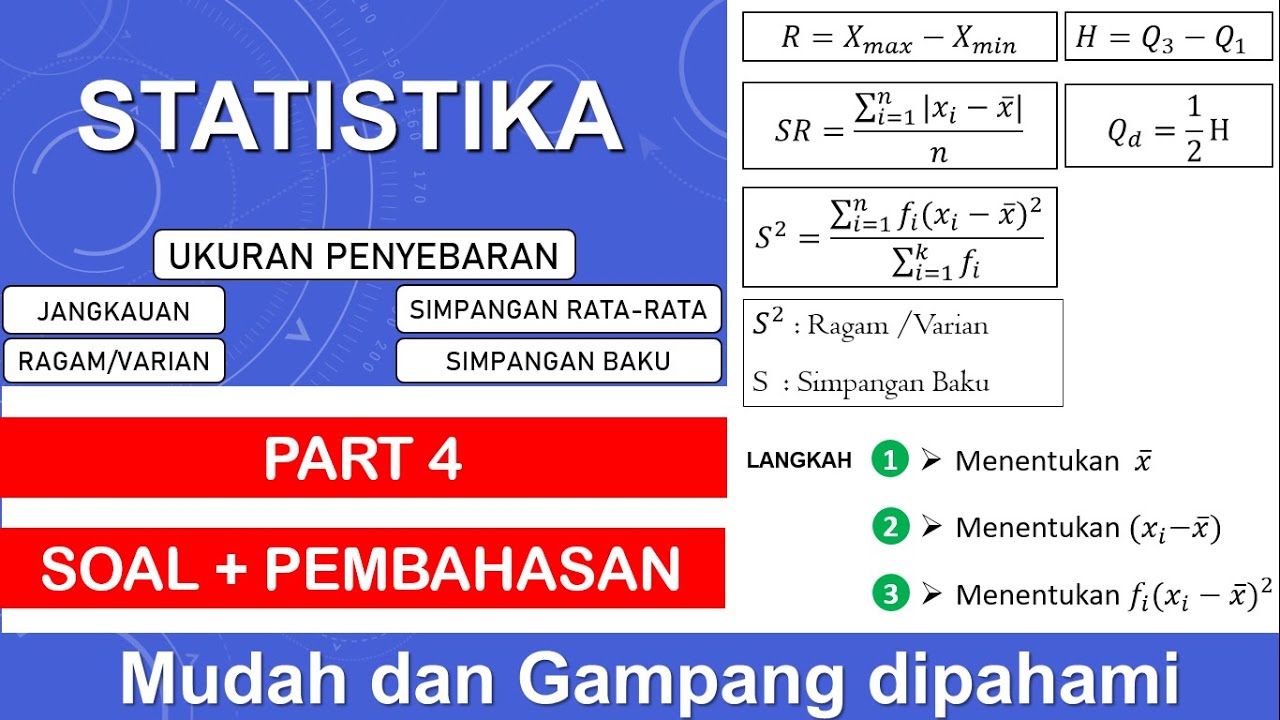
- 😀 The range (J) is calculated as the difference between the largest value (Xmax) and the smallest value (Xmin) in a data set.
- 😀 The script provides an example to calculate the range for a data set, where the range of family members from a male dormitory is 7 (9 - 2).
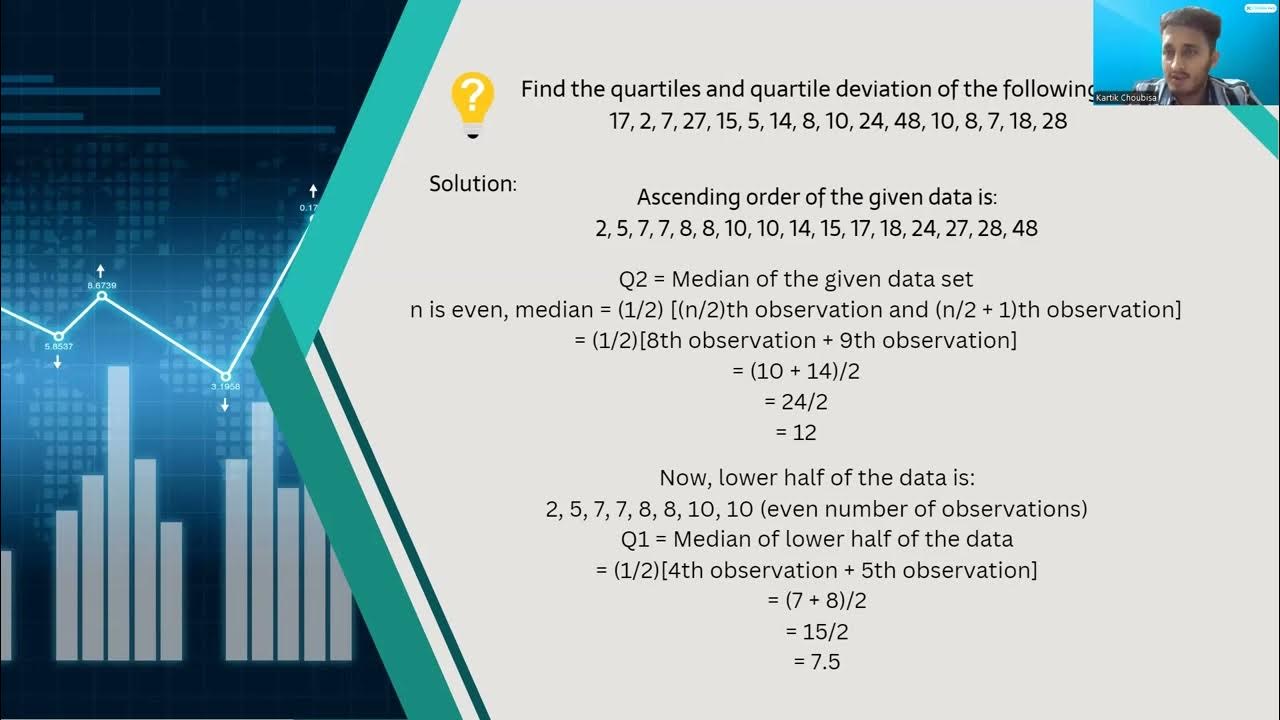
- 😀 The interquartile range (IQR) is the difference between the third quartile (Q3) and the first quartile (Q1).
- 😀 The script explains how to calculate the interquartile range using linear interpolation, with a result of 4.75 for the given example.
- 😀 The semi-interquartile range (or quartile deviation) is half the interquartile range, which is 2.375 in the example provided.
- 😀 The mean deviation (simpangan rata-rata) measures how much each datum deviates from the mean, and is calculated using absolute differences.
- 😀 The script demonstrates how to calculate the mean deviation for the prices of 5 notebooks, resulting in a mean deviation of 1.2.
- 😀 Variance (ragam) measures the average squared deviation from the mean, and is calculated using squared differences from the mean.
- 😀 The standard deviation (simpangan baku) is the square root of the variance, and in the example, it is 1.32 for the data set provided.
Q & A
What is the formula for calculating the range of a data set?
-The range of a data set is calculated by subtracting the smallest value (X_min) from the largest value (X_max). The formula is: Range (J) = X_max - X_min.
How is the interquartile range (IQR) determined?
-The interquartile range (IQR) is determined by subtracting the first quartile (Q1) from the third quartile (Q3). The formula is: IQR = Q3 - Q1.
What is the method used to find the third quartile (Q3) when the data set has an even number of data points?
-To find the third quartile (Q3) with an even number of data points, the process involves calculating the position of Q3, then using linear interpolation if the position is a decimal. For example, Q3 might be interpolated between the 5th and 6th data points.
What is the definition of the semi-interquartile range (or quartile deviation)?
-The semi-interquartile range, also known as the quartile deviation, is half of the interquartile range. It is calculated as: Semi-IQR = (Q3 - Q1) / 2.
How is the mean deviation (simpangan rata-rata) calculated?
-The mean deviation is calculated by finding the average of the absolute deviations of each data point from the mean. The formula is: Mean Deviation = (1/n) * Σ|Xi - X̄|, where Xi is each data point and X̄ is the mean of the data set.
How is variance (ragam) calculated for a data set?
-Variance is calculated by finding the average of the squared deviations of each data point from the mean. The formula is: Variance (σ²) = Σ(Xi - X̄)² / n, where Xi is each data point, X̄ is the mean, and n is the number of data points.
What is the relationship between variance and standard deviation?
-The standard deviation is the square root of the variance. It is a measure of the spread of a data set, expressed in the same units as the original data. The formula is: Standard Deviation (σ) = √Variance.
In the example provided, how is the range of the number of family members in the dormitory calculated?
-In the example, the data points for the number of family members are 5, 7, 4, 3, 9, and 2. After sorting the data, the range is calculated by subtracting the smallest value (2) from the largest value (9), resulting in a range of 7.
What is the formula for calculating the standard deviation for a sample?
-The standard deviation for a sample is calculated using the formula: s = √(Σ(Xi - X̄)² / (n - 1)), where Xi is each data point, X̄ is the sample mean, and n is the number of data points in the sample.
How is the variance of a data set calculated using a table?
-To calculate the variance using a table, create a table with columns for each data point, the deviation from the mean, and the squared deviations. Then, sum the squared deviations and divide by the number of data points (for a population) or by (n - 1) for a sample.
Outlines

Cette section est réservée aux utilisateurs payants. Améliorez votre compte pour accéder à cette section.
Améliorer maintenantMindmap

Cette section est réservée aux utilisateurs payants. Améliorez votre compte pour accéder à cette section.
Améliorer maintenantKeywords

Cette section est réservée aux utilisateurs payants. Améliorez votre compte pour accéder à cette section.
Améliorer maintenantHighlights

Cette section est réservée aux utilisateurs payants. Améliorez votre compte pour accéder à cette section.
Améliorer maintenantTranscripts

Cette section est réservée aux utilisateurs payants. Améliorez votre compte pour accéder à cette section.
Améliorer maintenantVoir Plus de Vidéos Connexes

Ukuran Penyebaran Data Tunggal | Statistika Matematika Wajib Kelas 12 | Catatan Matematika @Bang-RP
JANGKAUAN, HAMPARAN, SIMPANGAN KUARTIL, SIMPANGAN RATA RATA, RAGAM DAN STANDAR DEVIASI

Range, variance and standard deviation as measures of dispersion | Khan Academy
Statistika Part. 4 | Ukuran Penyebaran, Ragam, Varian, Simpangan Rata-rata, Simpangan Baku
dispersion

Ukuran Penyebaran Data | Statistika Kelas 8
5.0 / 5 (0 votes)
