STATPRO - 10 Point and Interval Estimate of population Mean
Summary
TLDRThis video tutorial explains how to estimate a population mean using confidence intervals. The process involves using a sample's mean, standard deviation, and a chosen confidence level (99% in this case). The video walks through the steps: calculating degrees of freedom, finding the critical t-value, determining the margin of error, and using these values to form a confidence interval. By the end of the video, viewers understand how to compute an interval estimate and interpret it to gauge the true population mean with a specified level of confidence.
Takeaways
- 😀 Takeaway 1: The script explains how to calculate the point and interval estimate for a population mean using sample data.
- 😀 Takeaway 2: The sample size (n) is 25, the sample mean (×x) is 18, and the sample standard deviation (s) is 1.3.
- 😀 Takeaway 3: The confidence level for the interval estimate is 99%.
- 😀 Takeaway 4: Degrees of freedom (df) are calculated as n - 1, which in this case is 24.
- 😀 Takeaway 5: The critical value (t-value) is found using the t-distribution table, which for 24 degrees of freedom and 99% confidence is 2.797.
- 😀 Takeaway 6: The formula for the margin of error (E) is: E = t × (s / √ n).
- 😀 Takeaway 7: The margin of error is calculated to be 0.73 by substituting the known values into the formula.
- 😀 Takeaway 8: The confidence interval is found by subtracting and adding the margin of error to the sample mean.
- 😀 Takeaway 9: The resulting confidence interval for the population mean is between 17.27 and 18.73.
- 😀 Takeaway 10: The 99% confidence interval indicates that the true population mean is likely to fall within this range, with 99% confidence.
Q & A
What is the sample size in this case?
-The sample size is 25, as the analysis is based on a sample of 25 trainees.
What is the sample mean age of the trainees?
-The sample mean age of the trainees is 18 years.
What is the sample standard deviation for the age of the trainees?
-The sample standard deviation is 1.3 years.
What is the confidence level used in this example?
-The confidence level used is 99%.
How is the degrees of freedom calculated?
-The degrees of freedom (df) is calculated by subtracting 1 from the sample size, so df = 25 - 1 = 24.
Where do you find the critical value (t-value) for the 99% confidence level?
-You find the critical value by referring to a t-distribution table with 24 degrees of freedom and a 99% confidence level. The critical value in this case is 2.797.
How is the margin of error calculated?
-The margin of error is calculated using the formula: E = t × (s / √n), where t is the critical value, s is the sample standard deviation, and n is the sample size. In this case, E = 2.797 × (1.3 / √25) = 0.73.
What is the formula used to compute the confidence interval?
-The formula for the confidence interval is: (sample mean - margin of error, sample mean + margin of error). In this case, it is (18 - 0.73, 18 + 0.73), resulting in a confidence interval of (17.27, 18.73).
What does the confidence interval represent in this example?
-The confidence interval represents the range within which we estimate the population mean age of the trainees lies, with 99% confidence. In this case, we estimate the population mean to be between 17.27 and 18.73 years.
Why do we use the t-distribution instead of the z-distribution in this example?
-The t-distribution is used because the sample size is small (n = 25), and we are using the sample standard deviation rather than the population standard deviation. The t-distribution is more appropriate for small sample sizes and when the population standard deviation is unknown.
Outlines

Cette section est réservée aux utilisateurs payants. Améliorez votre compte pour accéder à cette section.
Améliorer maintenantMindmap

Cette section est réservée aux utilisateurs payants. Améliorez votre compte pour accéder à cette section.
Améliorer maintenantKeywords

Cette section est réservée aux utilisateurs payants. Améliorez votre compte pour accéder à cette section.
Améliorer maintenantHighlights

Cette section est réservée aux utilisateurs payants. Améliorez votre compte pour accéder à cette section.
Améliorer maintenantTranscripts

Cette section est réservée aux utilisateurs payants. Améliorez votre compte pour accéder à cette section.
Améliorer maintenantVoir Plus de Vidéos Connexes
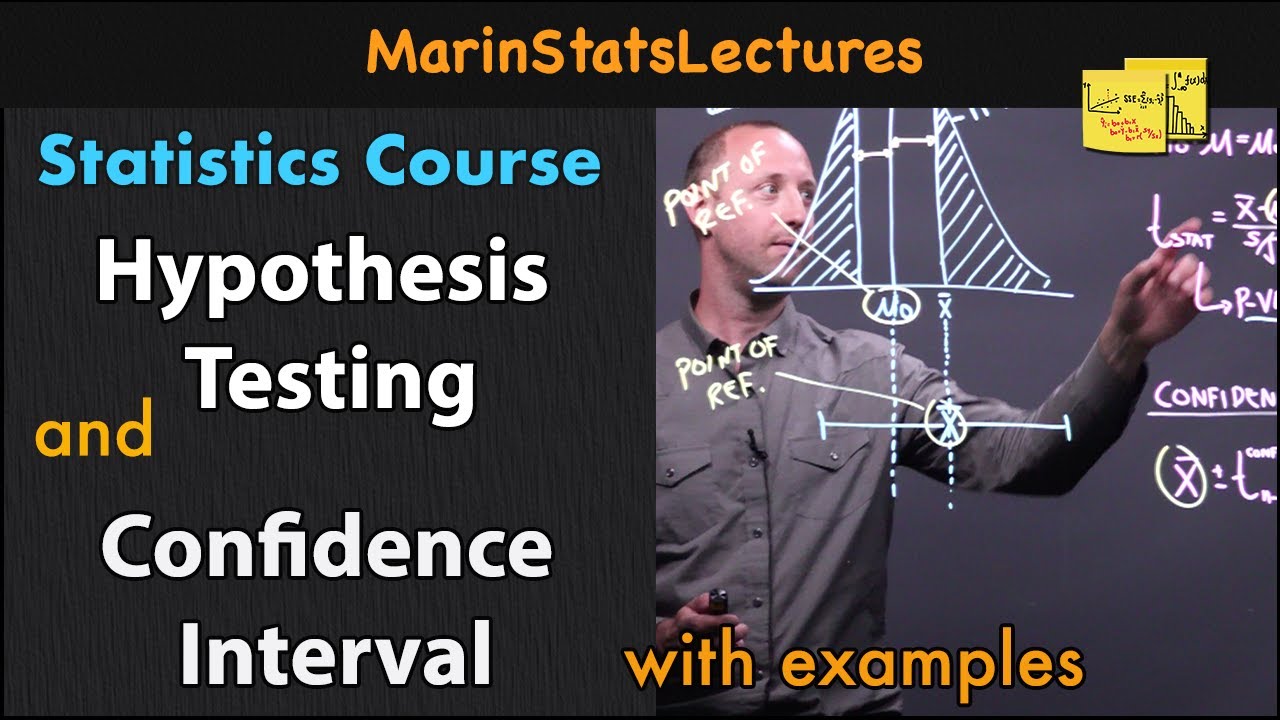
Hypothesis Test vs. Confidence Interval | Statistics Tutorial #15 | MarinStatsLectures
Understanding Confidence Intervals: Statistics Help
Confidence Interval [Simply explained]

Student's T Distribution - Confidence Intervals & Margin of Error
Normal Approximation to Sample Mean
Confidence Intervals, Clearly Explained!!!
5.0 / 5 (0 votes)
