MaTek 1 Menggambar grafik Fungsi Linier #Part 6#Matematika Teknik 1
Summary
TLDRThis video tutorial guides viewers through graphing mathematical functions, focusing on linear and quadratic equations. The instructor demonstrates how to plot the graphs of y = 2x + 6 and 3x - y = 3, providing step-by-step instructions for creating tables of values and plotting the points on a coordinate grid. The lesson also covers graphing a quadratic function, y = x² - 1, emphasizing the use of multiple points for accuracy. The friendly and informal teaching style aims to make graphing clear and easy to understand for students.
Takeaways
- 😀 The lesson focuses on graphing linear and quadratic functions, starting with the basic principles of plotting points on a coordinate plane.
- 😀 The first function is a linear equation: y = 2x + 6. The teacher demonstrates how to calculate values and plot them on a graph using a table.
- 😀 For the linear function y = 2x + 6, the teacher starts by substituting x = 0, which results in y = 6, and then plots the point (0, 6).
- 😀 The second key point for the linear function is when y = 0, which leads to solving for x. Substituting y = 0 gives x = -3, resulting in the point (-3, 0).
- 😀 Once the points (0, 6) and (-3, 0) are plotted, the teacher emphasizes the importance of drawing a straight line through these points to form the graph of the function.
- 😀 The second linear function, y = 3x - 3, follows a similar process: first, the teacher finds the point (0, -3) and then the point (1, 0).
- 😀 For the second linear function, the teacher highlights how to plot these points and draw the corresponding straight line, just like in the first example.
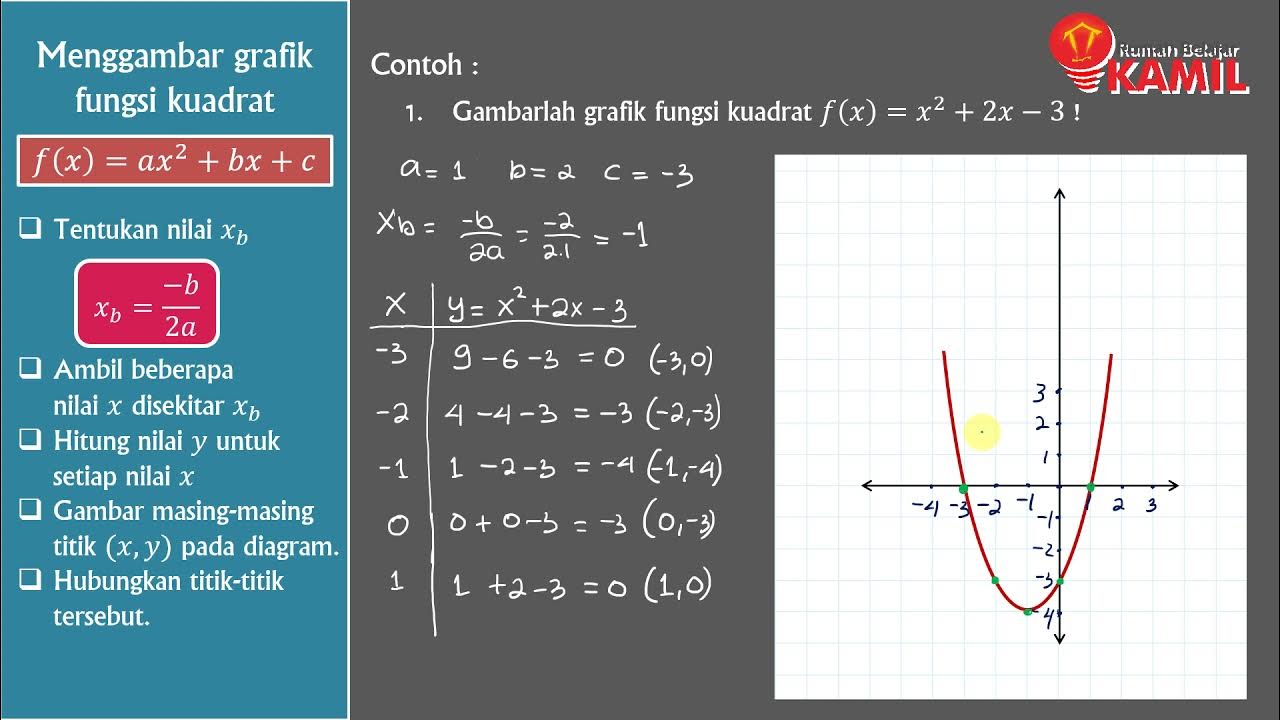
- 😀 In the third example, the lesson switches to a quadratic function, y = x² - 1. The teacher suggests using a minimum of five points to graph the curve effectively.
- 😀 The teacher demonstrates how to calculate and plot points for the quadratic function, including points such as (0, -1), (1, 0), (-1, 0), (2, 3), and (-2, 3).
- 😀 The lesson concludes with the teacher encouraging students to ensure their lines and curves pass through all plotted points, emphasizing the importance of accuracy in graphing.
Q & A
What is the first step in graphing a linear function like y = 2x + 6?
-The first step is to fill out a table of values for x and calculate the corresponding y values using the given equation.
Why is it recommended to use at least two points when graphing a linear function?
-Using at least two points ensures that you can draw a straight line, which is characteristic of linear functions.
In the linear function y = 2x + 6, what are the coordinates when x = 0?
-When x = 0, y = 6, so the coordinates are (0, 6).
What do you do after plotting the points on the graph for a linear function?
-After plotting the points, connect them with a straight line using a ruler to ensure the line is accurate.
What is the purpose of labeling the line with its equation after graphing?
-Labeling the line with its equation helps identify and clarify which function the graph represents.
How do you graph the linear equation y = 3x - 3?
-First, fill out a table of values, plot the points (0, -3) and (1, 0), then draw a straight line through them.
What is the process for graphing a quadratic function like y = x² - 1?
-Start by filling out a table with values for x, plot the points on the coordinate grid, then connect the points with a curved line to form the 'U' shape of a quadratic function.
Why is it important to use more than two points when graphing a quadratic function?
-Using more than two points helps accurately represent the curve of the quadratic function, ensuring the graph shows the correct 'U' shape.
In the quadratic function y = x² - 1, what is the value of y when x = 0?
-When x = 0, y = -1, so the point is (0, -1).
How do you graph the quadratic function y = x² - 1 with the points (0, -1), (1, 0), and (-1, 0)?
-Plot the points on the graph, then draw a smooth curve through them. The curve should show the 'U' shape characteristic of quadratic functions.
Outlines

Cette section est réservée aux utilisateurs payants. Améliorez votre compte pour accéder à cette section.
Améliorer maintenantMindmap

Cette section est réservée aux utilisateurs payants. Améliorez votre compte pour accéder à cette section.
Améliorer maintenantKeywords

Cette section est réservée aux utilisateurs payants. Améliorez votre compte pour accéder à cette section.
Améliorer maintenantHighlights

Cette section est réservée aux utilisateurs payants. Améliorez votre compte pour accéder à cette section.
Améliorer maintenantTranscripts

Cette section est réservée aux utilisateurs payants. Améliorez votre compte pour accéder à cette section.
Améliorer maintenantVoir Plus de Vidéos Connexes

Matematika Kelas 9 : Fungsi Kuadrat (Part 3 : Menggambar grafik fungsi kuadrat)

How to Create Desmos Art 2 - Curves, Waves, Ellipses - Step by Step Guide

SPtDV Matematika Kelas 10 • Part 1: Pertidaksamaan Linear & Kuadrat Dua Variabel

Kwadratische vergelijkingen (HAVO wiskunde B)

Grafik Garis Lurus Hal 207-219 Bab 5 Persamaan Garis Lurus Kelas 8 Kurikulum Merdeka Belajar

Quadrilaterals - Trapezoids, Parallelograms, Rectangles, Squares, and Rhombuses!
5.0 / 5 (0 votes)
