Grafik Garis Lurus Hal 207-219 Bab 5 Persamaan Garis Lurus Kelas 8 Kurikulum Merdeka Belajar
Summary
TLDRThis educational video teaches students about linear equations and graphing in mathematics, focusing on the concept of line depreciation in accounting. The script guides viewers through graphing the depreciation of vehicle prices, using the example of a truck losing value annually. It explains how to determine the intersection points of a line with the x and y axes, and how to represent the depreciation using a linear equation. Additionally, the script explores the basics of graphing linear equations, emphasizing the use of two points to form a straight line and how to interpret various equations on a coordinate plane.
Takeaways
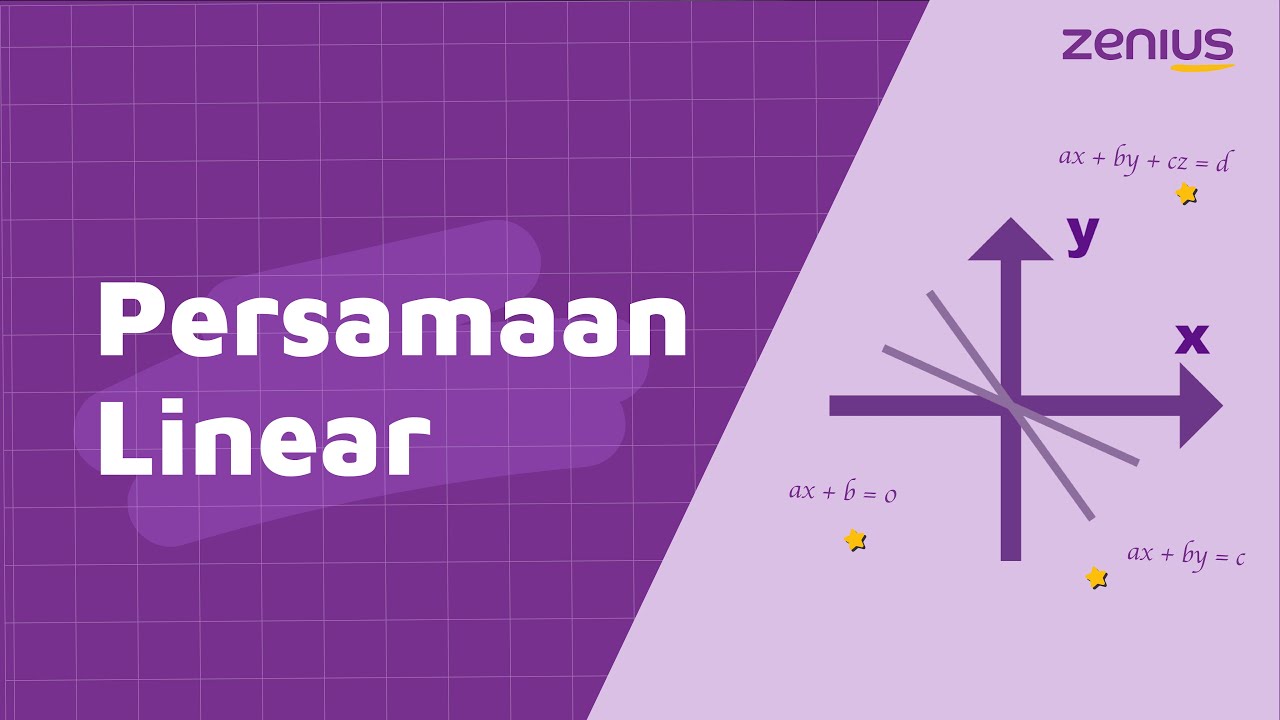
- 😀 The lesson focuses on linear equations, particularly graphing straight lines based on given equations.
- 😀 A straight-line equation, such as depreciation of assets, can be represented by equations like y = 360 - 12x.
- 😀 The process of finding the intersection points of a linear equation with the x-axis and y-axis is demonstrated through substitution.
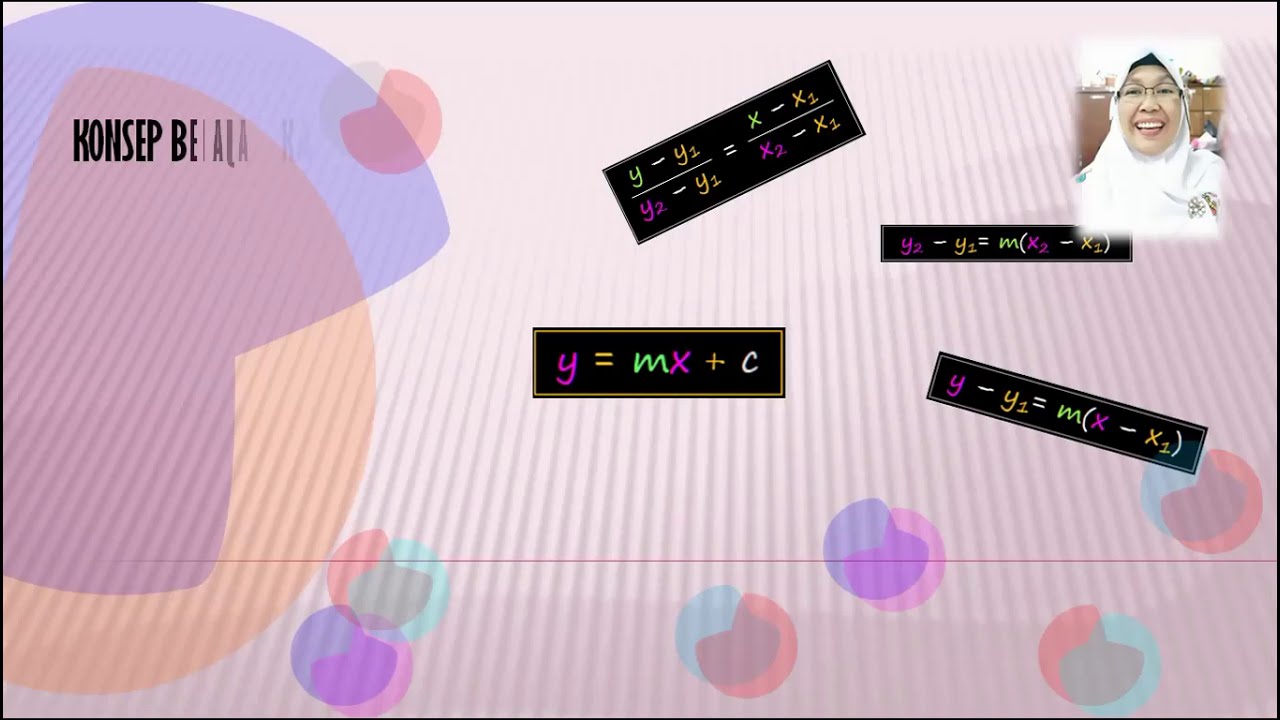
- 😀 The general form of a straight-line equation is y = mx + c, where m is the slope and c is the y-intercept.
- 😀 To graph a linear equation, it's sufficient to use just two points, typically the intersection points with the x and y axes.
- 😀 An example equation y = 360 - 12x was used to explain the steps to find intersection points by substituting values for x and y.
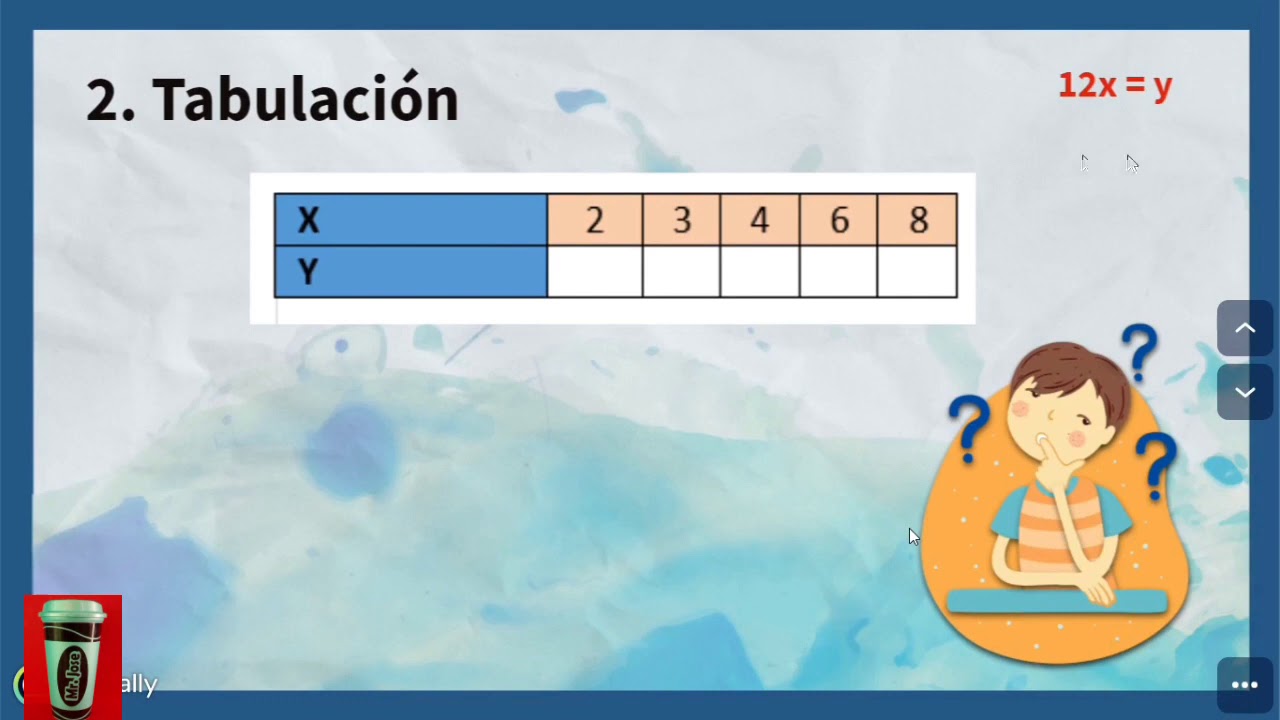
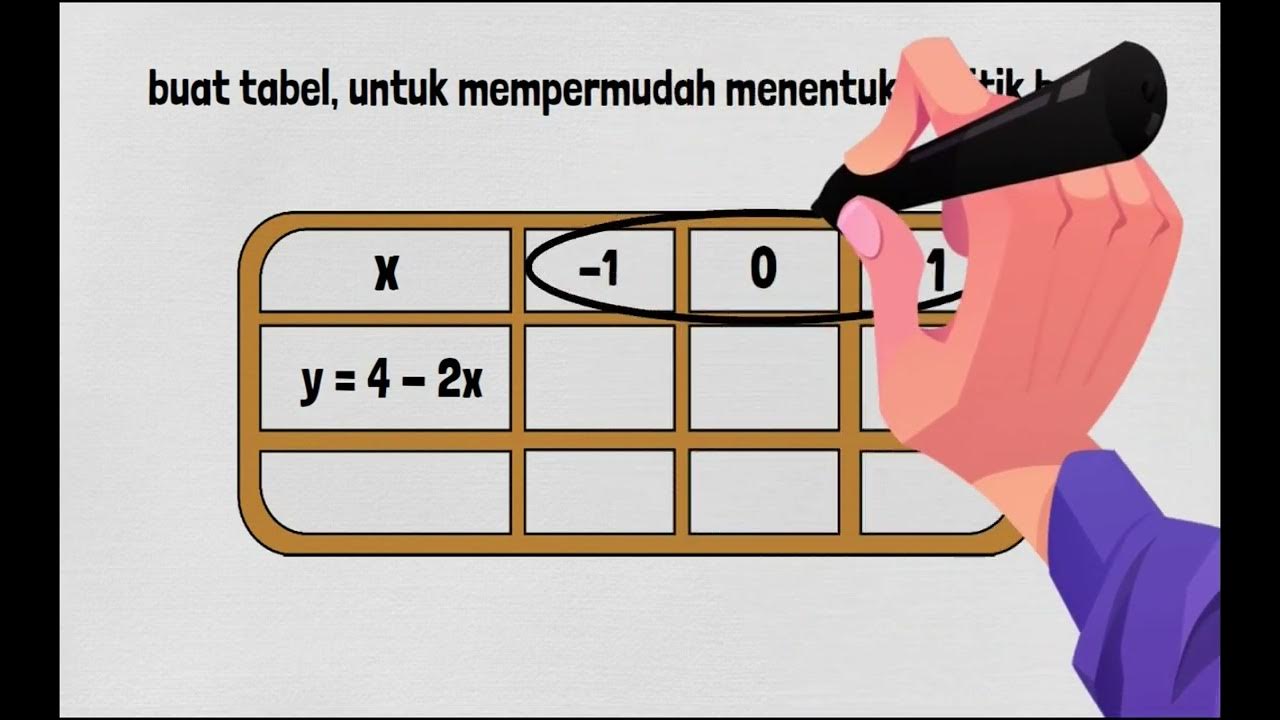
- 😀 The script explains the use of tables to calculate and organize the points of intersection for better clarity in graphing.
- 😀 The lesson highlights that graphs with a positive slope slope to the right and those with a negative slope slope to the left.
- 😀 The script demonstrates how different linear equations can have different slopes, and how these affect the direction of the line.
- 😀 Examples of linear equations that pass only through one axis, such as y = 8 (parallel to the x-axis), were also discussed.
Q & A
What is the main focus of the lesson in the video script?
-The main focus is on learning about linear equations and their graphical representation, specifically the concept of depreciation in accounting using a linear equation.
What is the significance of the example involving the truck depreciation?
-The example shows how the depreciation of a truck is represented by the linear equation y = 360 million - 12 million * x, where x is the truck's age. This illustrates how assets lose value over time in a linear fashion.
How is the intersection of the line with the x-axis and y-axis found in the depreciation example?
-The intersection points are found by setting x = 0 to find the y-intercept (360 million) and setting y = 0 to find the x-intercept (x = 30 years).
What role do the two points (0, 360 million) and (30, 0) play in the graph?
-These two points represent where the line intersects the y-axis (at x = 0) and the x-axis (at y = 0), respectively. These points help in drawing the line that represents the depreciation of the truck.
What is the general form of the linear equation given in the transcript?
-The general form of a linear equation is y = mx + c, where m is the slope (or gradient), and c is the y-intercept, which represents the value of y when x is 0.
Why is it sufficient to use only two points to draw a straight line on a graph?
-Any two points on a line are enough to uniquely determine the line because a straight line is defined by its slope and y-intercept, both of which can be derived from two points.
What is the meaning of the equation y = 3x + 2 in the context of the script?
-In this equation, 3 represents the slope (m), indicating that for each unit increase in x, y increases by 3 units. The constant 2 represents the y-intercept (c), showing where the line crosses the y-axis.
How are the points on the graph of y = -1/2x - 1 derived?
-The points are derived by substituting values for x into the equation. For example, when x = 0, y = -1; and when y = 0, solving for x gives x = -2.
What is the difference between graphs with positive and negative gradients as discussed in the script?
-Graphs with a positive gradient (like A and C) slope upward to the right, while graphs with a negative gradient (like B and D) slope downward to the right.
What are the commonalities and differences between the graphs in figures 5.6a, 5.6b, 5.6c, and 5.6d?
-Graphs 5.6a and 5.6c have the same gradient (positive), while 5.6b and 5.6d have the same gradient (negative). All graphs intersect the x-axis and y-axis at different points but pass through (0, 0).
Outlines

This section is available to paid users only. Please upgrade to access this part.
Upgrade NowMindmap

This section is available to paid users only. Please upgrade to access this part.
Upgrade NowKeywords

This section is available to paid users only. Please upgrade to access this part.
Upgrade NowHighlights

This section is available to paid users only. Please upgrade to access this part.
Upgrade NowTranscripts

This section is available to paid users only. Please upgrade to access this part.
Upgrade NowBrowse More Related Video

Kurikulum Merdeka Matematika Kelas 8 Bab 5 Persamaan Garis Lurus
Model Matematika PLSV, Kelas VII
Teori Program Linear | Materi SNBT (UTBK) Penalaran Matematika
Variación lineal: expresión algebraica, tabulación y gráfica.
MATEMATIKA VIII Bab 4 Bagian 2 PERSAMAAN GARIS dengan KEMIRINGAN
Grafik Garis Lurus
5.0 / 5 (0 votes)