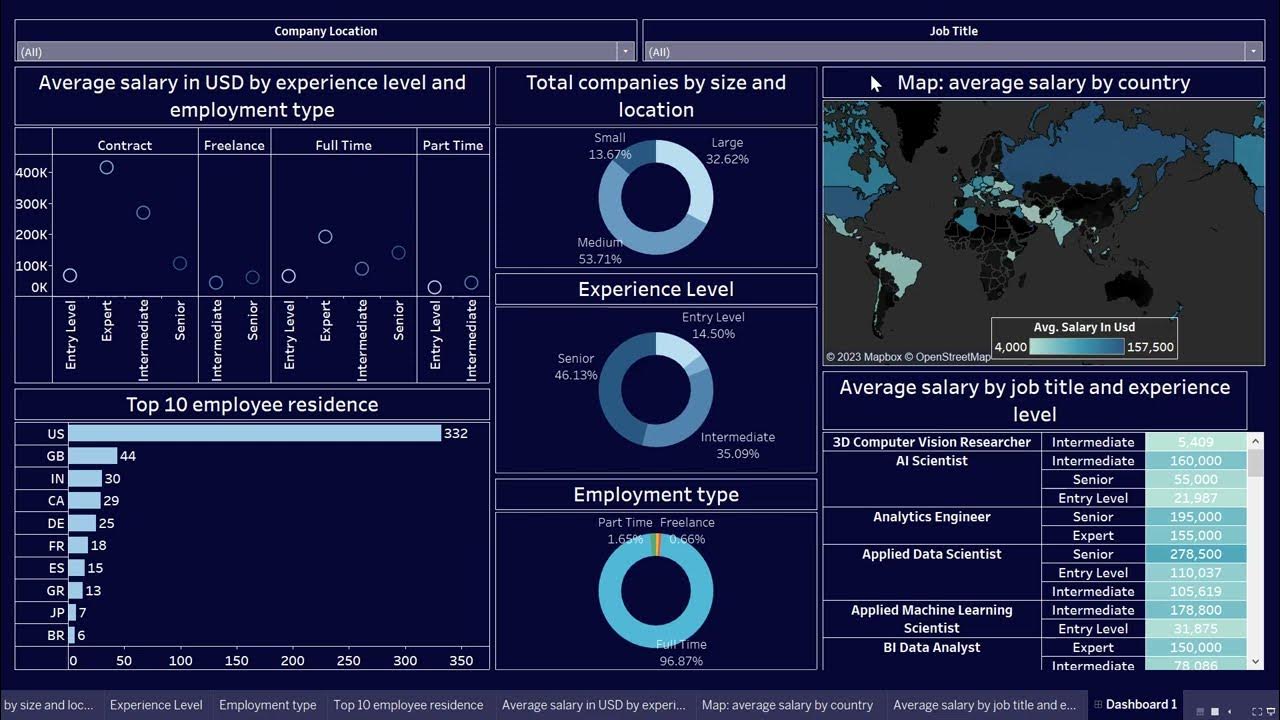
Create an Amazing Power BI Dashboard in 12 minutes | IBM HR Dataset
Summary
TLDRIn this tutorial, the presenter walks through the creation of an interactive dashboard using the IBM HR dataset. The dashboard includes several visualizations, such as charts for employee distribution by hourly rate, age, education, job role, department, and more. The video demonstrates importing the dataset, creating and formatting various charts (clustered, bar, and donut), and adding interactivity. The final result is a dynamic dashboard where users can filter and view data across different categories, all while customizing visual elements like titles, labels, and colors.
Takeaways
- 😀 The tutorial teaches how to create an interactive dashboard using IBM HR data.
- 😀 The IBM HR dataset includes various fields such as hourly rate, age, gender, education, job role, and more.
- 😀 The data consists of 1,470 rows and includes both continuous and categorical variables.
- 😀 Users can explore the dataset by selecting fields like age, business travel, department, marital status, and others.
- 😀 The tutorial covers the process of importing the dataset into the dashboard tool (Power BI).
- 😀 The first chart created is for employees by hourly rate, using a clustered column chart.
- 😀 The script explains how to duplicate and format charts for different data categories, such as employees by age and education field.
- 😀 Various chart types are used, including clustered bar charts, Dona charts, and column charts, to visualize different categories.
- 😀 Formatting tips include customizing titles, axis labels, data labels, and borders to enhance the visual appeal of the charts.
- 😀 The dashboard allows for interactivity, enabling users to filter data by different categories, such as gender or marital status.
- 😀 The tutorial concludes by showing how to add an IBM logo to the dashboard and finalize the design for presentation.
Q & A
What is the main objective of the tutorial?
-The main objective of the tutorial is to guide viewers through the process of creating an interactive dashboard using the IBM HR dataset. The tutorial covers importing the dataset, creating various charts, and formatting them to visualize employee data effectively.
What kind of data does the IBM HR dataset contain?
-The IBM HR dataset contains both categorical and continuous variables. Categorical variables include fields like Age, Gender, Job Role, Department, and Marital Status, while continuous variables include fields like Hourly Rate, Monthly Income, Total Working Years, and Years at the Company.
How do you import the IBM HR dataset into Power BI?
-To import the IBM HR dataset into Power BI, click on 'Get Data', select 'Text/CSV', and then load the dataset. Once loaded, the data fields will be available for creating charts and visualizations.
What chart is used to visualize employees by hourly rate?
-A clustered column chart is used to visualize employees by hourly rate. The X-axis represents the hourly rate, and the Y-axis shows the employee count.
How is the chart for employees by age different from the one for hourly rate?
-The chart for employees by age uses the 'Age' field on the X-axis instead of 'Hourly Rate'. The minimum value for the X-axis is set to 18 since all employees in the dataset are over 18 years old.
What is the purpose of using clustered bar charts in the dashboard?
-Clustered bar charts are used to compare different categories of employees, such as by Education Field, Job Role, Business Travel, and Department. These charts allow for easy comparison of employee counts across various categories.
What kind of chart is used to display employee data by gender and marital status?
-Donut charts are used to display employee data by gender and marital status. These charts show the percentage distribution of employees within each category (e.g., male/female or married/single).
How do you make the charts interactive for the user?
-The charts are made interactive by enabling users to filter data through clickable options. When a user selects a category (e.g., marital status or gender), the corresponding chart values update to reflect the selection.
How do you format the charts to improve their appearance?
-Charts are formatted by setting titles, removing unnecessary gridlines and axis labels, adjusting colors, and enabling features like bold data labels and rounded corners. These formatting steps enhance the chart’s readability and visual appeal.
Why is it important to use blue borders and rounded corners for the IBM logo?
-The blue borders and rounded corners for the IBM logo create a cohesive and polished design for the dashboard, aligning with the overall aesthetic of the dashboard and providing a professional appearance.
Outlines

Cette section est réservée aux utilisateurs payants. Améliorez votre compte pour accéder à cette section.
Améliorer maintenantMindmap

Cette section est réservée aux utilisateurs payants. Améliorez votre compte pour accéder à cette section.
Améliorer maintenantKeywords

Cette section est réservée aux utilisateurs payants. Améliorez votre compte pour accéder à cette section.
Améliorer maintenantHighlights

Cette section est réservée aux utilisateurs payants. Améliorez votre compte pour accéder à cette section.
Améliorer maintenantTranscripts

Cette section est réservée aux utilisateurs payants. Améliorez votre compte pour accéder à cette section.
Améliorer maintenantVoir Plus de Vidéos Connexes

Tableau Dashboard Tutorial dalam 12 Menit | Bahasa Indonesia

Getting Started With Using Maps In Tableau | Tableau Maps For Beginners | Data Deep Dive

Google Data Studio Tutorial 📊 - How to build a Dashboard with GDS

Create Data Science Jobs salaries dashboard with Tableau in 25 minutes

Learn Tableau in 15 minutes and create your first report (FREE Sample Files)

How I Built a ONE CLICK Excel Dashboard with ChatGPT 😎
5.0 / 5 (0 votes)
