Belajar Statistika - Makna & Intepretasi Diagram Pencar (Scatter Plot)
Summary
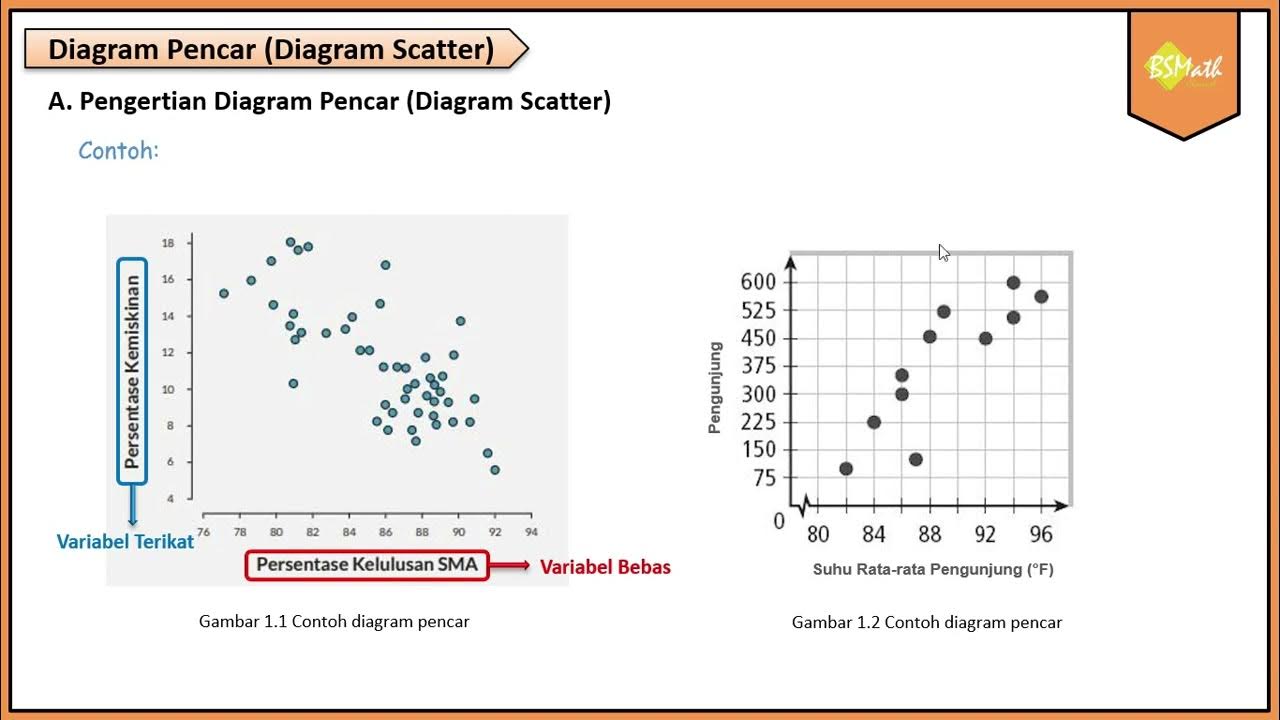
TLDRIn this educational video, viewers are introduced to scatter plots and their role in illustrating the relationships between two numerical variables. The video explains the different patterns of relationships, including linear and non-linear, as well as the direction (positive or negative) and strength (weak, moderate, or strong) of these relationships. Using the example of height and shoe size, the presenter demonstrates a positive linear correlation, encouraging viewers to create their own scatter plots and interpret the data. This video serves as a valuable resource for understanding data visualization and its applications in statistical analysis.
Takeaways
- 😀 Scatter plots are effective for analyzing the relationship between two numerical variables.
- 📈 There are three key pieces of information conveyed in scatter plots: relationship pattern, direction, and strength.
- 🔄 The relationship pattern can be linear or nonlinear, including forms such as exponential and parabolic.
- 🔼 The direction of the relationship can be positive (both variables increase) or negative (one variable increases while the other decreases).
- 💪 Strength of the relationship is determined by the distribution of points: weak if scattered without a pattern, strong if points cluster closely.
- 📏 A strong positive linear relationship suggests that as one variable increases, the other does too, such as height and shoe size.
- 🧩 Understanding these concepts helps in interpreting data and making informed decisions based on variable interactions.
- 📊 Practicing with real data enhances comprehension of scatter plot analysis.
- ❓ Viewers are encouraged to create their own scatter plots to interpret relationships between variables, fostering active learning.
- 🕌 The video emphasizes the importance of visualizing data to uncover insights about variable relationships.
Q & A
What is the main topic discussed in the video?
-The video discusses scatter plots and how to analyze the relationship between two numerical variables using these diagrams.
What are the three key pieces of information that a scatter plot provides?
-A scatter plot provides information on the pattern of relationship, the direction of relationship, and the strength of relationship between two variables.
What does the pattern of relationship in a scatter plot indicate?
-The pattern of relationship indicates how one variable influences another, which can be linear, non-linear, exponential, parabolic, or other forms.
What are the two directions of relationship mentioned in the video?
-The two directions of relationship are positive and negative. A positive relationship means that as one variable increases, the other also increases, while a negative relationship indicates that as one variable increases, the other decreases.
How is the strength of relationship represented in a scatter plot?
-The strength of relationship is represented by how closely the points cluster together. A weak relationship shows points scattered without any particular pattern, while a strong relationship shows points closely aligned, potentially forming a straight line.
What example is used in the video to illustrate the relationship between two variables?
-The example used is the relationship between height and shoe size, which demonstrates a positive, linear, and strong correlation.
What conclusion can be drawn from the relationship between height and shoe size based on the scatter plot?
-The conclusion is that taller individuals are likely to have larger shoe sizes, indicating a direct linear relationship between the two variables.
What does it mean if points in a scatter plot are widely dispersed without a clear pattern?
-If points are widely dispersed without a clear pattern, it indicates a very weak relationship between the variables, suggesting little to no influence of one variable on the other.
What activity is suggested for viewers at the end of the video?
-Viewers are encouraged to create their own scatter plot and interpret the relationship between two variables as a way to reinforce their understanding.
What is the significance of understanding scatter plots in data analysis?
-Understanding scatter plots is significant in data analysis as it helps visualize and interpret relationships between variables, which is crucial for drawing meaningful conclusions from data.
Outlines

Cette section est réservée aux utilisateurs payants. Améliorez votre compte pour accéder à cette section.
Améliorer maintenantMindmap

Cette section est réservée aux utilisateurs payants. Améliorez votre compte pour accéder à cette section.
Améliorer maintenantKeywords

Cette section est réservée aux utilisateurs payants. Améliorez votre compte pour accéder à cette section.
Améliorer maintenantHighlights

Cette section est réservée aux utilisateurs payants. Améliorez votre compte pour accéder à cette section.
Améliorer maintenantTranscripts

Cette section est réservée aux utilisateurs payants. Améliorez votre compte pour accéder à cette section.
Améliorer maintenantVoir Plus de Vidéos Connexes

Menggambar Diagram Pencar Kelas XI Fase F Kurikulum Merdeka

Analisis Korelasi#STIE GICI

Regresion Lineal

Explanatory and Response Variables, Correlation (2.1)

Pengertian Diagram Pencar - Matematika Wajib SMA Kelas XI Kurikulum Merdeka

Must know Visualization in Statistics | Descriptive Statistics | Ultimate Guide !! | Part 10
5.0 / 5 (0 votes)
