The Normal Distribution, Clearly Explained!!!
Summary
TLDRThis video, produced by the University of North Carolina's genetics department, introduces the normal (Gaussian) distribution, often known as the bell curve. It explains the basic concepts, focusing on human height measurements as an example. The video compares the height distributions of newborns and adults, discussing the significance of the mean and standard deviation. Viewers learn that 95% of data falls within two standard deviations of the mean and how this distribution applies to many real-world phenomena. The video concludes with a teaser on the central limit theorem, a key concept in statistics.
Takeaways
- 📊 Normal distribution, also known as Gaussian distribution, is often referred to as a bell-shaped curve due to its symmetry.
- 📈 The curve represents various probabilities, such as height, showing that most people are close to the average, while very short or tall people are rare.
- 👶 Two examples of normal distributions include newborn baby heights (average: 20 inches) and adult male heights (average: 70 inches).
- 📉 Babies have a smaller standard deviation (0.6) compared to adults (4), meaning their height range is narrower.
- 🔢 The width of the curve is determined by the standard deviation, which affects the probability distribution for different values.
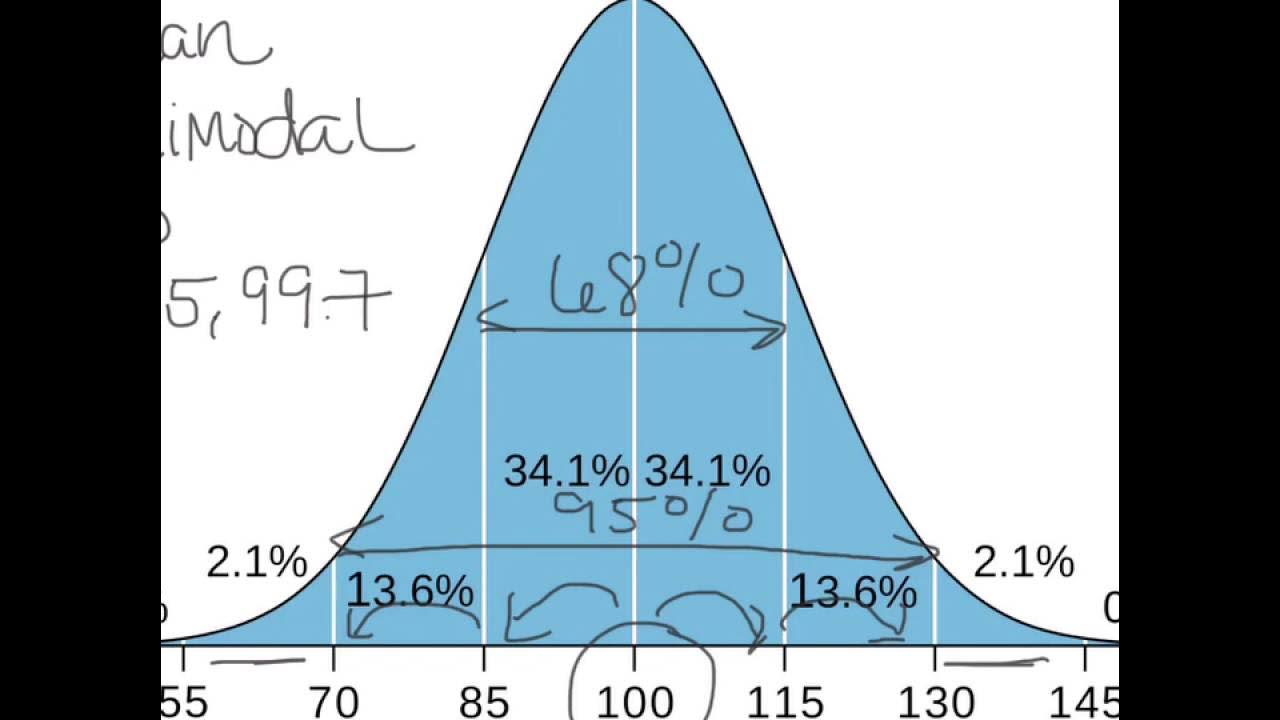
- 📐 In normal distribution, 95% of measurements fall within two standard deviations from the mean.
- 👨👧👦 A wider range of adult heights results in a broader, shorter curve compared to the narrower, taller curve for baby heights.
- 🔄 The normal distribution is common in nature and plays a key role in statistics, particularly due to the central limit theorem.
- 🌍 Beyond height, normal distribution can apply to weight, commuting times, and many other real-world measurements.
- 🎉 Future episodes will explore topics like the central limit theorem, which underpins the usefulness of normal distribution in statistics.
Q & A
What is the normal distribution often called and why?
-The normal distribution is often called a bell-shaped curve because it is a symmetrical curve that looks like a bell.
What does the y-axis represent in a normal distribution graph?
-The y-axis represents the relative probability of observing a particular value, such as height. For example, it shows the likelihood of someone being really short, average, or tall.
Why is the bell-shaped curve low for extreme values of height and high for average values?
-The curve is low for extreme values because it's relatively rare to see someone who is extremely short or tall. The curve is high around the average because it's common to see someone with an average height.
What does the curve tell us about the heights of newborn babies versus adults?
-Newborn babies have a more narrow and taller curve, centered around 20 inches, with fewer height variations. Adults, in contrast, have a wider and shorter curve centered around 70 inches, reflecting a greater variation in heights.
What is the standard deviation, and how does it affect the normal distribution curve?
-The standard deviation measures how spread out the values are from the mean. A smaller standard deviation leads to a narrower and taller curve, while a larger one results in a wider and shorter curve.
Why do babies have a smaller standard deviation in height compared to adults?
-Babies have less variation in height, so their standard deviation is smaller (0.6 inches), while adults have a greater variation in height, leading to a larger standard deviation (4 inches).
What does the 95% rule in normal distribution mean?
-In a normal distribution, 95% of the data falls within plus or minus two standard deviations from the mean. This means most measurements are close to the average.
What measurements fall within the 95% range for newborn babies and adults?
-For newborns, 95% of heights fall between 20 inches plus or minus 1.2 inches (18.8 to 21.2 inches). For adults, 95% of heights fall between 70 inches plus or minus 8 inches (62 to 78 inches).
What are the two main things needed to draw a normal distribution curve?
-To draw a normal distribution curve, you need the average measurement (to center the curve) and the standard deviation (to determine the curve's width and height).
What is the central limit theorem, and why is it important?
-The central limit theorem explains why normal distributions appear frequently in nature. It states that the sum of many independent random variables tends to follow a normal distribution, making it highly useful for statistics.
Outlines

Cette section est réservée aux utilisateurs payants. Améliorez votre compte pour accéder à cette section.
Améliorer maintenantMindmap

Cette section est réservée aux utilisateurs payants. Améliorez votre compte pour accéder à cette section.
Améliorer maintenantKeywords

Cette section est réservée aux utilisateurs payants. Améliorez votre compte pour accéder à cette section.
Améliorer maintenantHighlights

Cette section est réservée aux utilisateurs payants. Améliorez votre compte pour accéder à cette section.
Améliorer maintenantTranscripts

Cette section est réservée aux utilisateurs payants. Améliorez votre compte pour accéder à cette section.
Améliorer maintenantVoir Plus de Vidéos Connexes

Distribusi Normal | Konsep Dasar dan Sifat Kurva Normal | Matematika Peminatan Kelas 12

Metode Statistika | Sebaran Peluang Kontinu | Mengenal Sebaran Normal

Distribusi Normal Bagian 1 Matematika Minat Kelas XII Semester 2

Normal Curve - Bell Curve - Standard Deviation - What Does It All Mean? Statistics Help

Apa itu Kurva Normal?
What is a Bell Curve or Normal Curve Explained?
5.0 / 5 (0 votes)
