Correlation Research

NKU CITE
13 May 201408:12

Summary

TLDRProfessor Doug Crawl from Northern Kentucky University discusses correlational research, which explores the association between two variables. He explains that correlation aids in prediction, using ACT scores and college performance as an example. Crawl clarifies that correlation values range from -1 to 1, indicating both the direction and strength of the relationship. He emphasizes that correlation does not imply causation, highlighting the importance of not confusing correlation with causative relationships. The lecture also touches on the direction problem and the third variable problem, using self-esteem and GPA, as well as ice cream sales and assaults, to illustrate these concepts.

Takeaways

  • 🔍 Correlational research aims to discover if two variables are associated or related.
  • 📊 A variable is a characteristic that varies among individuals, such as age or self-esteem levels.
  • 🧐 Knowing the correlation between two variables can help in making predictions about one variable when the other is known.
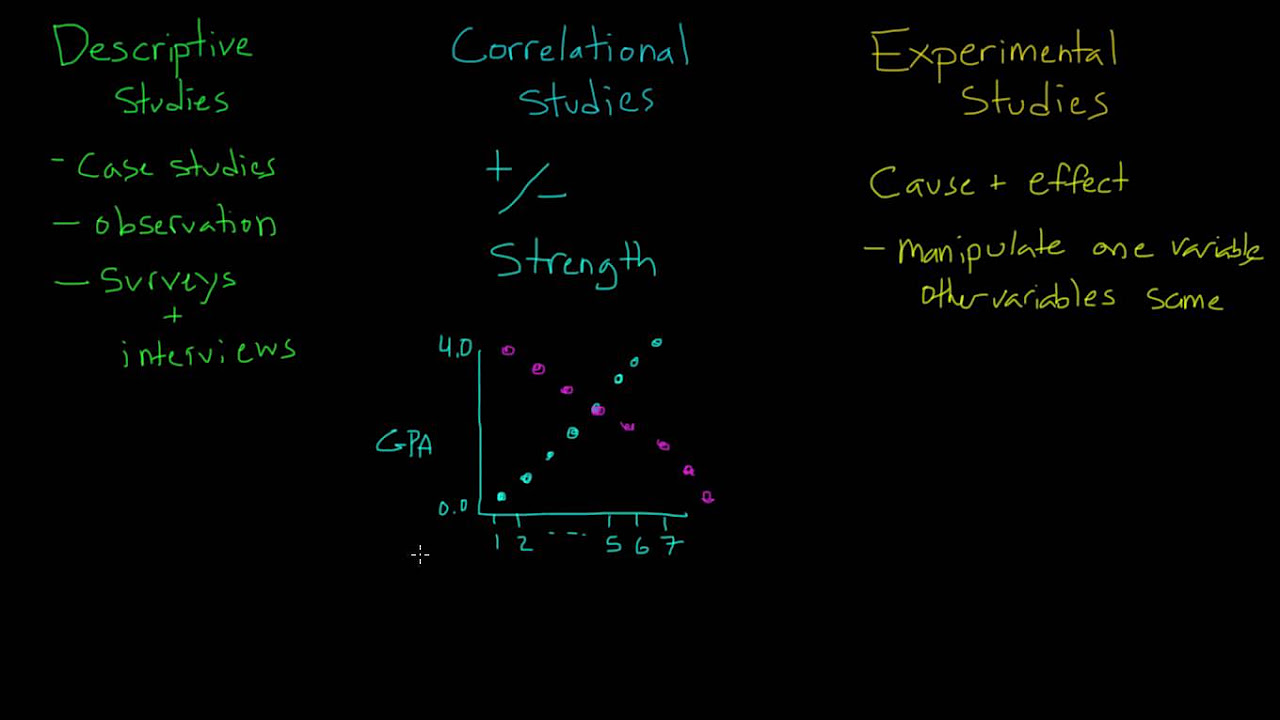
  • 📉 Correlations range from -1 to 1, with -1 indicating a perfect negative correlation, 1 indicating a perfect positive correlation, and 0 indicating no correlation.
  • đŸ”Œ Positive correlations suggest that as one variable increases, the other also increases, while negative correlations suggest an inverse relationship.
  • 📈 The magnitude of the correlation coefficient indicates the strength of the relationship between the variables.
  • đŸš« Correlation does not imply causation; just because two variables are correlated does not mean one causes the other.
  • ❓ The direction problem in correlations arises when it's unclear whether variable A causes B or B causes A.
  • 🔄 The third variable problem occurs when two variables are correlated not because they directly affect each other, but because they are both influenced by a third variable.
  • đŸ§Ș To determine causality, experiments are necessary rather than relying solely on correlational data.

Q & A

  • What is correlational research?

    -Correlational research is a type of study that seeks to discover if two variables are associated or related in some way.

  • What is a variable in the context of research?

    -A variable is a characteristic that everyone has but with different values among individuals, such as age or levels of self-esteem.

  • Why is it important to understand correlations?

    -Understanding correlations is important for prediction. If two variables are correlated, knowing one allows us to make an educated guess about the other.

  • Give an example of a correlation mentioned in the script.

    -An example of a correlation given in the script is between ACT scores and college performance.

  • What is the range of correlation coefficients?

    -Correlation coefficients range from -1 to 1, where -1 indicates a perfect negative correlation, 1 indicates a perfect positive correlation, and 0 indicates no correlation.

  • What does the direction of a correlation indicate?

    -The direction of a correlation indicates whether the variables increase or decrease together. A positive correlation means they rise and fall together, while a negative correlation means they have a reciprocal relationship.

  • What does the magnitude of a correlation tell us?

    -The magnitude of a correlation, ignoring the sign, tells us how strongly related the variables are and informs us about the confidence we can have in our predictions.

  • Why can't we infer causality from correlation?

    -We cannot infer causality from correlation because correlation only indicates an association between variables, not a cause-and-effect relationship.

  • What is the 'direction problem' in correlation studies?

    -The 'direction problem' refers to the issue of determining whether variable A causes variable B, variable B causes variable A, or if there is a bidirectional relationship.

  • What is the 'third variable problem' in correlation studies?

    -The 'third variable problem' occurs when two variables are correlated not because they directly cause each other, but because a third variable influences both of them.

  • What does the example of ice cream sales and assaults illustrate about correlations?

    -The example of ice cream sales and assaults illustrates that two variables can be correlated due to a third variable (heat), and this correlation does not imply causation between the two variables themselves.

Outlines

00:00

🔍 Understanding Correlational Research

Doug Craw, a professor at Northern Kentucky University, introduces correlational research, which aims to identify associations between two variables. Variables are characteristics that vary among individuals, such as age or self-esteem. The purpose of studying correlations is to make predictions; knowing one variable can help us estimate another. For instance, there's a correlation between ACT scores and college performance, suggesting that higher ACT scores are generally indicative of better college performance. However, this is not a perfect rule, as exceptions exist. Craw emphasizes that while correlations can range from -1 to 1, indicating the strength and direction of the relationship, they do not imply causation. A positive correlation means variables increase or decrease together, while a negative correlation implies an inverse relationship. The magnitude of the correlation indicates the strength of the relationship and the reliability of predictions based on it. Despite their usefulness, correlations must be interpreted with caution, as they do not provide insight into causality.

05:01

đŸ€” The Limitations of Correlations in Determining Causality

This paragraph delves into the limitations of using correlations to determine causality. Craw discusses how correlations can suggest a relationship between variables but do not prove that one causes the other. He uses the example of self-esteem and GPA, which may be correlated, but it's unclear whether self-esteem leads to higher GPA or vice versa. The 'direction problem' arises because it's challenging to determine the cause-and-effect relationship solely from correlation data. The 'third variable problem' further complicates matters, as two variables might be correlated not because they directly influence each other but because a third, unseen variable influences both. Craw gives the example of ice cream sales and assault rates, which correlate positively across months but are actually both influenced by temperature. This illustrates how correlations can be misleading without considering other potential factors. The paragraph concludes by stating that to understand causality, one must conduct experiments rather than relying solely on correlational data.

Mindmap

Keywords

💡Correlational Research

Correlational research is a method used in the field of psychology and other sciences to investigate the relationship between two variables. It aims to determine whether there is an association between them. In the context of the video, the professor explains that correlational research seeks to find out if two variables are related in some way, which is crucial for making predictions. For example, the professor discusses the correlation between ACT scores and college performance, indicating that a higher ACT score generally correlates with better college performance.

💡Variables

In research, a variable is a characteristic that can take on different values across individuals. The video script uses age and self-esteem as examples, where everyone has an age and a level of self-esteem, but these values vary from person to person. Variables are central to correlational research as they are the elements being analyzed for potential relationships or associations.

💡Prediction

Prediction in the context of the video refers to the ability to make an educated guess about the value of one variable based on the knowledge of another variable with which it is correlated. The professor emphasizes the importance of correlations for prediction, as knowing one variable can provide insights into the likely value of another. This is exemplified by the relationship between ACT scores and college performance.

💡Correlation Coefficient

The correlation coefficient is a statistical measure that ranges from -1 to 1, indicating the strength and direction of a relationship between two variables. In the script, the professor clarifies that the coefficient must be a number within this range, and it cannot be a value like '227' or 'a platypus', which would be incorrect. The coefficient's value indicates how closely the variables are related and in which direction the relationship goes.

💡Positive Correlation

A positive correlation implies that as one variable increases, the other variable also increases. The video uses the example of studying hours and exam performance, suggesting that more hours of studying are likely associated with better exam performance. This concept is important in understanding how changes in one variable can be associated with changes in another.

💡Negative Correlation

A negative correlation is present when one variable increases while the other decreases. The script gives the example of classes skipped and exam performance, indicating that as the number of classes skipped increases, exam performance tends to decrease. This shows an inverse relationship between the two variables.

💡Magnitude

Magnitude in the context of correlation refers to the strength of the relationship between two variables, disregarding the direction. The professor explains that a high magnitude (e.g., +0.8 or -0.8) indicates a strong relationship, while a low magnitude (e.g., +0.1 or -0.1) suggests a weak relationship. This is important for understanding the reliability of predictions based on the correlation.

💡Causation

Causation refers to a cause-and-effect relationship between variables, where a change in one variable leads to a change in another. The video script emphasizes that correlation does not imply causation. Even if two variables are correlated, it does not necessarily mean that one causes the changes in the other. This is a critical concept in research as it highlights the limitations of correlational studies in determining causality.

💡Direction Problem

The direction problem in correlational research is the challenge of determining whether variable A causes changes in variable B, or if it's the other way around, or if there is a reciprocal relationship. The script uses the example of self-esteem and GPA, where it's unclear whether higher self-esteem leads to better GPA or if a higher GPA leads to increased self-esteem.

💡Third Variable Problem

The third variable problem occurs when two variables are correlated not because one causes the other, but because both are influenced by a third, unseen variable. The professor gives the example of ice cream sales and assaults being correlated, but both are actually influenced by temperature. This problem illustrates the complexity of interpreting correlations and the potential for misleading conclusions if not properly considered.

Highlights

Correlational research aims to discover if two variables are associated or related.

A variable is a characteristic that everyone has but with different values, such as age or self-esteem.

Correlations are used for prediction, allowing educated guesses about one variable based on knowledge of another.

ACT scores and college performance are an example of correlated variables.

Correlations range from -1 to 1, indicating the strength and direction of the relationship between variables.

A positive correlation indicates variables rise and fall together, while a negative correlation suggests a reciprocal relationship.

The magnitude of correlation, ignoring the sign, indicates the strength of the relationship.

Highly correlated variables allow for more confident predictions, whereas weak correlations provide less certainty.

A correlation of zero indicates no relationship between variables.

Correlation does not imply causation; knowing two variables are correlated does not reveal the causal relationship.

The direction problem in correlations arises when it's unclear whether one variable causes the other or vice versa.

The third variable problem suggests that two correlated variables might be related due to a third, underlying variable causing both.

An example of the third variable problem is the correlation between ice cream sales and assaults, which both peak in the summer due to heat.

To determine causality, an experiment is needed rather than relying solely on correlational data.

Transcripts

play00:06

my name is Doug crawl I'm a professor in

play00:09

the department of psychological science

play00:10

at Northern Kentucky University and I'm

play00:12

going to talk to you about correlational

play00:14

research correlational research seeks to

play00:16

discover if two variables are associated

play00:19

or related in some way now a variable is

play00:21

a characteristic that everyone has but

play00:24

different people have different values

play00:26

so for example everyone has an age but

play00:28

different people have different ages

play00:30

everyone has a level of self-esteem but

play00:32

different people have different levels

play00:33

of

play00:34

self-esteem now one of the main reasons

play00:36

that we want to know about correlations

play00:38

is for prediction that if two variables

play00:40

are correlated then that means knowing

play00:42

one allows us to take an educated guess

play00:44

about what the other one is likely to be

play00:47

for example something like ACT scores

play00:49

and college performance there's a

play00:51

correlation between ACT scores and

play00:54

college performance so if we know a

play00:56

person's ACT score that gives us a clue

play00:59

about what the person's College

play01:00

performance it's likely to be now it's

play01:02

not perfect sometimes people may have a

play01:04

relatively low ACT score and end up

play01:06

doing brilliantly in college and

play01:07

sometimes people have a really high ACT

play01:09

score and end up doing not so well in

play01:11

college but as a general rule ACT score

play01:14

tells us something about what their

play01:15

college performance is likely to be all

play01:18

right well correlations range from one

play01:21

to minus one got to be a number

play01:23

somewhere in that range so if we

play01:24

calculate the correlation it turns out

play01:26

to be you know uh 227 or a platypus or

play01:31

by low cell High then something's wrong

play01:33

because it can't be that it's got to be

play01:35

a number somewhere from one to minus one

play01:38

now we could break that down into a

play01:39

couple of aspects one is the direction

play01:43

is it a positive number or a negative

play01:45

number a positive correlation like

play01:48

positive. 53 or positive. 27 that

play01:51

indicates that the variables rise and

play01:54

fall together so as one variable

play01:56

increases then the other variable also

play01:57

increases if one of them is falling then

play01:59

the other one uh tends to be low as well

play02:02

so for example something like uh hour

play02:04

studying and exam performance we would

play02:07

expect that uh as the number of ours

play02:10

studied goes up that exam performance

play02:12

would also tend to go up if uh hour

play02:14

studying is low then exam performance

play02:16

would also tend to be low on the other

play02:18

hand a negative correlation means that

play02:20

they have a reciprocal relationship

play02:22

whereas one of them increases the other

play02:24

one tends to fall or if one of them is

play02:26

low then the other one tends to be high

play02:28

maybe something like uh classes skipped

play02:31

and exam performance we would expect

play02:33

that as the number of classes skipped

play02:35

goes up that exam performance would tend

play02:37

to be lower to the degree that people

play02:39

don't skip classes then we would expect

play02:41

exam performance to be higher so that's

play02:43

the direction but then there's also the

play02:45

magnitude that is how strongly uh

play02:49

related are they ignoring the sign so

play02:51

two variables could be very strongly

play02:53

correlated like positive point8 or

play02:55

negative .8 or they could be only weekly

play02:58

correlated like positive .1 or NE .1 and

play03:02

the magnitude kind of is it tells us

play03:04

something about how strongly related

play03:06

they are and so it tells us something

play03:07

about how confident we can be in our

play03:10

prediction if two things are highly

play03:12

correlated The Knowing one really tells

play03:14

us a lot about what the other one is

play03:15

likely to be if they're only weakly

play03:17

correlated then it tells us relatively

play03:20

little about what the other one is

play03:21

likely to be and of course if they're

play03:22

correlated zero then it tells us nothing

play03:24

about what the other one is likely to

play03:26

be but probably the most important thing

play03:28

to keep in mind with regard to

play03:30

correlations is that correlation is not

play03:33

causation that is if we know that two

play03:35

variables are correlated that doesn't

play03:36

tell us anything about what the causal

play03:38

relationship between those variables

play03:40

might be uh so for example let's suppose

play03:43

we do a study here at NKU and uh we

play03:46

discover that self-esteem and GPA are

play03:49

positively correlated maybe positive. 35

play03:53

and so if you as you might recall that

play03:55

means that as one of them Rises the

play03:57

other one tends to rise if one of them

play03:58

is low than the other one tends to be

play04:00

low and let's suppose someone hears

play04:01

about that and maybe writes an article

play04:03

in a newspaper somewhere and says study

play04:05

reveals that self-esteem and GPA are

play04:09

positively correlated therefore if we

play04:11

want people's grades to be higher what

play04:12

we need to do is build up everyone's

play04:14

level of self-esteem now that would work

play04:17

if the reason that GPA and self-esteem

play04:20

are correlated is that esteem is driving

play04:23

GPA then that would mean that any

play04:25

changes that occur on self-esteem those

play04:27

should cause changes to occur on GPA

play04:30

but that might not necessarily be the

play04:32

reason that they're correlated there's

play04:33

at least a couple of problems that we

play04:35

need to address uh one of them is the

play04:38

direction problem the direction problem

play04:40

is that it could be that self-esteem is

play04:42

causing GPA but it could also be that

play04:44

GPA is causing self-esteem and if that

play04:48

second one is true then that would mean

play04:50

that raising self-esteem won't do

play04:51

anything to GPA because GPA is the one

play04:54

causing self-esteem and uh we really

play04:57

have no way of determining which of

play04:58

those two things might be it could be

play05:00

either one now some of you might be

play05:02

thinking that sometimes we could

play05:04

probably be fairly confident in ruling

play05:06

out one of those two directions so for

play05:09

example before we knew that smoking

play05:11

caused lung cancer we probably knew that

play05:13

they were correlated so you can imagine

play05:15

a a researcher sitting there thinking

play05:17

about this like let's see H smoking and

play05:20

lung cancer are positively correlated

play05:23

could it be that getting lung cancer

play05:27

causes people to start smoking and

play05:29

doesn't seem very likely and so it's

play05:31

probably the other way and that sort of

play05:33

reasoning of if we could just eliminate

play05:35

One Direction then we would know that it

play05:36

was the other one that sort of reasoning

play05:38

would work if this was the only problem

play05:40

but it's not the only problem we also

play05:42

have the third variable problem that is

play05:45

if two variables are correlated it could

play05:47

be that neither one causes the other but

play05:49

rather they're correlated because some

play05:51

third variable causes both so for

play05:54

example with regard to self-esteem and

play05:55

GPA maybe uh good nutrition

play05:59

tends to cause people to feel good about

play06:01

themselves have higher esteem and also

play06:03

tends to cause them to have higher

play06:04

grades except it might not be nutrition

play06:07

maybe it's U getting enough sleep maybe

play06:10

when people get enough sleep then that

play06:11

tends to cause them to have higher

play06:14

esteem and also to have higher grades

play06:16

except it might not be that maybe it's a

play06:18

a supportive family to the degree that

play06:21

people have a supportive family maybe

play06:22

that causes them to have a higher esteem

play06:24

and also higher grades and of course we

play06:26

could you know sit here all day trying

play06:28

to think about different things it could

play06:30

possibly be and there's really no way to

play06:31

know let me give you my favorite example

play06:33

of the third variable problem I read

play06:35

this years ago I'm not sure exactly

play06:36

where it was but apparently ice cream

play06:39

sales vary according to the month of the

play06:41

year they tend to be relatively low in

play06:43

January and then they go up and up and

play06:45

up and they tend to Peak somewhere

play06:46

around August and then they tend to

play06:48

decline and be relatively low again in

play06:50

December same sort of thing for assaults

play06:52

like aggravated assaults tend to be

play06:55

relatively low in January and then they

play06:57

go up and up and up Peak somewhere

play06:58

around August and then they tend to

play07:00

decline and be relatively low in

play07:01

December and so as a result those two

play07:03

things are positively correlated they

play07:05

tend to rise and fall together now can

play07:07

imagine someone thinking about the

play07:08

direction of that they might think let's

play07:11

see is it the case that when people uh

play07:13

beat somebody up they think you know it

play07:16

would be a great way to top off this

play07:17

evening big bowl of ice

play07:19

cream I don't think that's it maybe it's

play07:23

that when they uh eat a big bowl of ice

play07:25

cream then they get that brain freeze

play07:28

thing and that makes them mad and so

play07:30

they decide to haul up and punch someone

play07:32

in the nose no that doesn't make sense

play07:34

to me either and you could probably

play07:36

guess what the third variable probably

play07:38

is it's probably heat that to the degree

play07:40

that it gets hot then that tends to

play07:42

cause ice cream sales to go up that also

play07:43

tends to cause assaults to go up as well

play07:46

so with a correlation we can't tell

play07:49

anything about causality and yet we

play07:50

often want to know something about cause

play07:53

and so correlations are not going to

play07:55

help us if we want to know about cause

play07:57

we're going to have to do an experiment

play07:59

o

Rate This
★
★
★
★
★

5.0 / 5 (0 votes)

Étiquettes Connexes
CorrelationResearch MethodsPredictive AnalysisPsychological ScienceCausationStatistical AnalysisEducational InsightsData InterpretationSelf-esteemAcademic Performance
Besoin d'un résumé en anglais ?