EPANET Tutorial 02.05 - Setting Object Properties | Hydraulic Modeling
Summary
TLDRIn this tutorial, Mark Wilson, founder of a Q model, guides viewers through hydraulic modeling using EPANET software. He demonstrates adding labels, toggling their visibility, and correcting pipe IDs. Mark also shows how to modify attributes for pipes, nodes, and links, referencing the EPANET user's manual for accurate data entry. The video covers setting up a reservoir, junctions, and pipes with specific dimensions and roughness, as well as configuring a pump with a single-point curve. The aim is to inspire confidence in hydraulic modeling for new users, with advanced topics to be explored in future videos.
Takeaways
- 📚 The video is a tutorial by Mark Wilson, the founder of a Q model, focusing on hydraulic modeling with EPANET.
- 🏷 Mark demonstrates how to add and toggle labels in the EPANET user interface for better visualization.
- 🔄 He shows that it's easy to change IDs of the pipes in the model, a feature that is more user-friendly than some commercial products.
- 🛠 Mark uses the selector tool to change the attributes of each feature, such as pipe IDs, to align with the EPANET user guide.
- 📈 The tutorial covers changing various attributes like elevation, demand, and roughness for nodes and links in the model.
- 🔍 It's shown that one can access and edit element data by double-clicking on an element or using the edit button.
- 🌡 The importance of setting the correct units of measurement, in this case, feet, is highlighted for accuracy in the model.
- 💧 Mark explains how to set up a reservoir with a fixed boundary condition at a specific head level.
- 🚰 The process of entering data for pipes, junctions, and a reservoir is detailed, emphasizing the ease of data entry in EPANET.
- 🔧 The tutorial includes instructions on setting up a pump with a design point or single-point curve, using curve ID for reference.
- 📊 Mark illustrates how to create a pump curve by inputting data points, which EPANET uses to generate a curve based on a default equation.
- 🎥 The video concludes with an invitation to subscribe for more tutorials and mentions of upcoming advanced EPANET videos.
Q & A
Who is the speaker in the video tutorial?
-The speaker in the video tutorial is Mark Wilson, the founder of a Q model.
What is the purpose of the tutorial?
-The purpose of the tutorial is to provide a visual representation of the EPANET user's manual and help new users get started with hydraulic modeling.
What is the first step Mark Wilson demonstrates in the tutorial?
-The first step Mark Wilson demonstrates is how to add labels to the map in the EPANET software.
How can users toggle the display of labels in the view options?
-Users can toggle the display of labels on and off in the view options within the EPANET software.
What is the function of the Escape key when digitizing in EPANET?
-The Escape key is used to cancel the digitizing process if the user decides not to finish it.
How can users change the IDs of pipes in EPANET?
-Users can change the IDs of pipes by using the selector tool, double-clicking on the element, and entering a new ID.
What is the significance of the pipe IDs in the EPANET model?
-The pipe IDs are important as they should match the IDs indicated in the EPANET drawing for the model to be accurate.
What is the default boundary condition for a reservoir in EPANET?
-The default boundary condition for a reservoir in EPANET is a fixed head at the specified elevation unless a head pattern is given.
How does one change the attributes of a junction in EPANET?
-To change the attributes of a junction in EPANET, one can double-click on the junction to bring up the editor and modify the elevation, demand, and base demand values.
What are the units of length used in the tutorial?
-The units of length used in the tutorial are feet.
How does the speaker demonstrate changing the values of pipe attributes?
-The speaker demonstrates changing the values of pipe attributes by accessing the editor for each pipe element and inputting the correct values for length, diameter, and roughness.
What is the purpose of the pump curve in EPANET?
-The pump curve in EPANET defines the relationship between the flow rate and the head produced by the pump, which is essential for modeling the pump's performance.
How does one create a pump curve with a single data point in EPANET?
-To create a pump curve with a single data point, one needs to go to the curve browser, create a new curve, and input the flow rate and head values. EPANET will use a default equation to generate the curve based on the single data point.
What are the initial, minimum, and maximum levels for the tank in the tutorial?
-The initial level for the tank in the tutorial is set to 4, the minimum level is 0, and the maximum level is 20, all measured above the tank's base level.
How can users subscribe to the playlist for more tutorials?
-Users can subscribe to the playlist by following the link provided in the video description or by finding the playlist on the platform where the video is hosted.
What advanced topics will be covered in future EPANET videos?
-Advanced topics to be covered in future EPANET videos include modeling hydropneumatic tanks and other advanced hydraulic modeling techniques.
Outlines
🛠️ Hydraulic Modeling Tutorial Overview
Mark Wilson introduces himself as the founder of a Q model and begins a tutorial focused on hydraulic modeling using EPANET software. The tutorial aims to guide new users through the software by following exercises from the EPANET user's manual. Mark demonstrates how to add labels to the map, toggle their visibility, and correct mistakes in the pipe IDs, showcasing the ease of editing in EPANET compared to other commercial products. He also explains how to change attributes of different features, such as pipe ID, elevation, and demand, using the software's interface.
🔧 Configuring EPANET Model Components
Continuing the tutorial, Mark Wilson details the process of entering data for pipes, junctions, reservoirs, pumps, and tanks within the EPANET model. He emphasizes the importance of setting initial levels, minimum and maximum levels for tanks, and correctly configuring the pump using a single-point curve. Mark illustrates how to create a pump curve by entering data points and how EPANET interpolates values between these points. He concludes the video by encouraging viewers to subscribe for more tutorials and hints at upcoming advanced videos on the subject.
Mindmap
Keywords
💡EPANET
💡Hydraulic Modeling
💡Tutorial
💡Labels
💡IDs
💡Attributes
💡Reservoir
💡Junction
💡Pump Curve
💡Tank
💡Units of Length
Highlights
Introduction by Mark Wilson, founder of a Q model, focusing on inspiring confidence in hydraulic modeling.
Tutorial is a continuation of previous ones, going through the EPANET user's manual with exercises.
Demonstration of adding labels to the map in the software.
Explanation of toggling label display on and off in view options.
Use of the Escape key to cancel ongoing digitizing tasks.
Correction of pipe IDs and showcasing the ease of modifying model attributes.
Tutorial on changing the attributes of each feature, such as pipe ID.
Instructions on adjusting node and link attributes according to the user guide.
Method of accessing element information through double-clicking.
Editing elevation and total head for a reservoir as a fixed boundary condition.
Setting units of length and other node attributes like demand and base demand.
Changing pipe attributes such as length, diameter, and roughness.
Alternative method of editing elements by single-clicking and using the edit button.
Entering data for pipes, junctions, and reservoirs in preparation for pump and tank setup.
Configuring the tank with initial level, minimum, and maximum levels, and diameter.
Setting up a pump using a design point or single-point curve.
Creating a pump curve with data points and the default EPANET equation.
Interpolation of values between multiple points on a pump curve.
Conclusion of the video with an invitation to subscribe for further tutorials and advanced EPANET videos.
Transcripts
hello folks my name is Mark Wilson and
I'm the founder of a Q model where we
inspire confidence in hydraulic modeling
this tutorial is a continuation of
previous tutorials we're going through
the EP annette user's manual and just
doing some of the exercises to give a
visual representation of the user's
manual and help new users get started
well let's get going one thing I didn't
do on the previous tutorial is do labels
okay if we click on the text or add
label button and then we click anywhere
in the map we can add a label then we
have to hit enter make a stick okay just
one thing that the user's guide doesn't
point out if you go back in here to view
options you can actually toggle the
display off and on
of those labels remember you can press
the Escape key if you start digitizing
something and then don't want to finish
one thing that we're going to do here
because I didn't have the map and the
users guide right in front of me while I
was digitizing the pipes is got them the
IDS a little bit wronged I just wanted
to show you that you can change those
and the model pretty readily this is
actually a little bit better easier
feature than some of the commercial
products where it's a little more
difficult to change IDs so I'm gonna go
ahead and use my selector tool I'm gonna
double click we're also talking in this
tutorial up changing the attributes of
each feature so this is the first
attribute we're going to change as pipe
ID I'm going to give this kind of a
dummy 12 ID just kind of as a
placeholder so then I can come over here
and change this one to a like it's
supposed to be on the drawing in EPA net
let's give this one the value of 24
right now and this one 30 then we can
start changing some of these other ones
think to this one seven this one is
supposed to be four okay now that we've
got all the pipes with the correct ID
according to the QuickStart user guide
we can go ahead and start changing some
of the other attributes I'm gonna refer
to page 14 and the users guide for the
table of values for nodes and links was
a starting in link 1 and we can access
the information in several different
ways
we can double click on an element this
brings up this little editor
the data we're changing here is the
elevation which is actually total head
for a reservoir so we're gonna give that
a 700 so this reservoir is a fixed
boundary condition so this if unless we
give it a head pattern it will always be
a boundary condition at 700 and then the
units of length in our case we're using
feet now go ahead and change node 2
which is a junction yeah it has an
elevation of 700 in a demand of 0 700
and a base demand of 0 so we'll leave
that and you get the picture I'll do the
rest of the nodes offline I'll just show
some links here number 1 is 3000 feet
long 14 inches diameter 14 inches
diameter and the roughness of 100 I
think we're all good to go on that one
and you can get the picture of how easy
it is to change values we'll just let me
show you one other thing here if you
single click on an element and then you
click the edit button it does the same
thing it brings up this little editor
window I'm going to go ahead and pause
the video right now while I finish up so
I've entered all the data for the pipes
and the junctions and the reservoir
now I'm going to go ahead and finish up
with doing the pump and the tank so
we're gonna give it an initial level of
4 and all these level initial minimum
and maximum are measured above the tank
base level so this elevation this is the
base level or you could consider at the
bottom of the tank that will have some
interesting ramifications when we try to
model hydropneumatic tanks has a tall
skinny tank or elevated story
and we'll cover that in a in the
advanced videos for now we'll just keep
working through this tutorial minimum
level we're gonna leave at zero maximum
level 20 and a diameter of 60 and again
we're in English units so that would be
in feet okay now for the pump we're
going to use a design point or single
point curve for this pump so all we
really need in here is the curve ID and
to create that curve what we have to do
is go over here into our browser
dude curve new and it kind of gives us a
starting ID here we can change this if
we want but since we named it in the
pump data as a curve ID one we're gonna
stick with that of course and this is a
pump curve and all we have to do is type
in our data points here 600 GPM at 150
feet of head now
when we only have a single point in here
it gives us a nice curve there based on
a default equation that's built into EP
Aneta if we were to add more points as
soon as we do that it's just gonna
and I do a point to point and then EPA
net will interpolate values between all
the different points so I could plug
zero flow here and we can do 200 and
that will there's a nice three-point
curve
several ways you can accomplish that
well that's all for this video I hope
you enjoyed that hope you subscribe to
the playlist to see their whole series
of these tutorials also and watch for ep
net advanced videos that I'll be posting
soon and good luck on your modeling
Ver Más Videos Relacionados
EPANET Tutorial 02.04 - Drawing The Network | Hydraulic Modeling
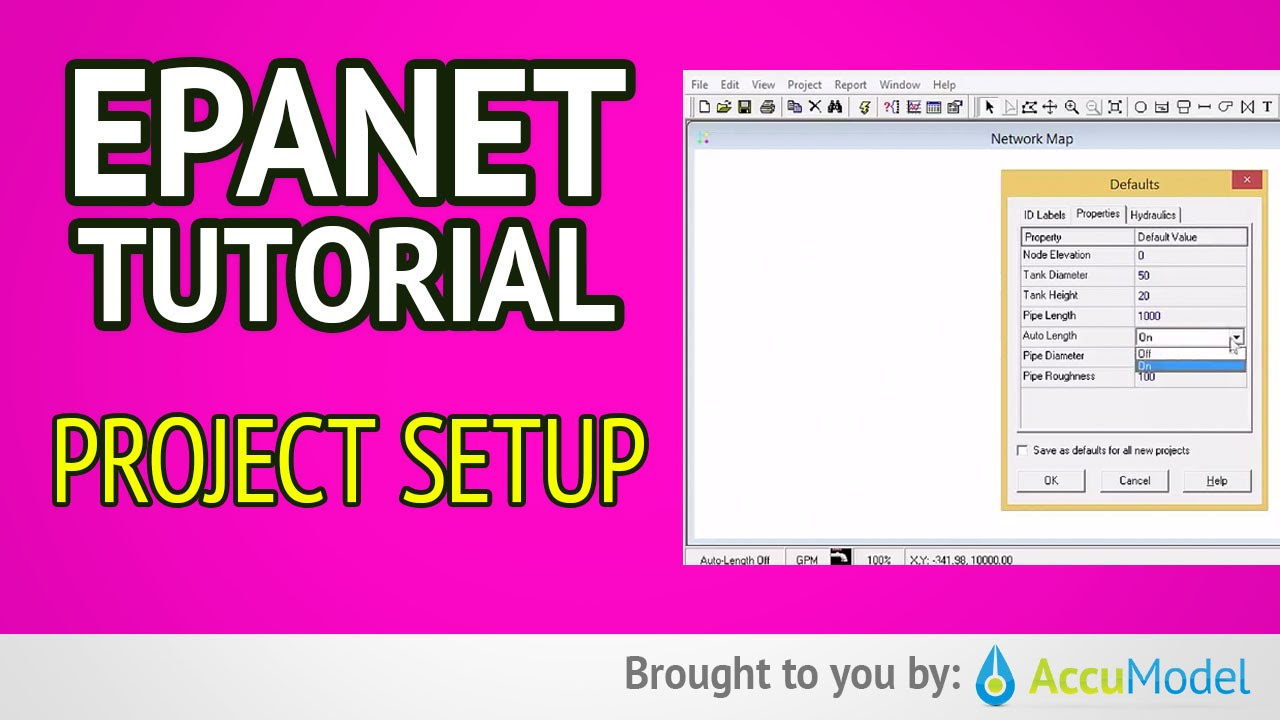
EPANET Tutorial 02.03 - Project Setup | Hydraulic Modeling
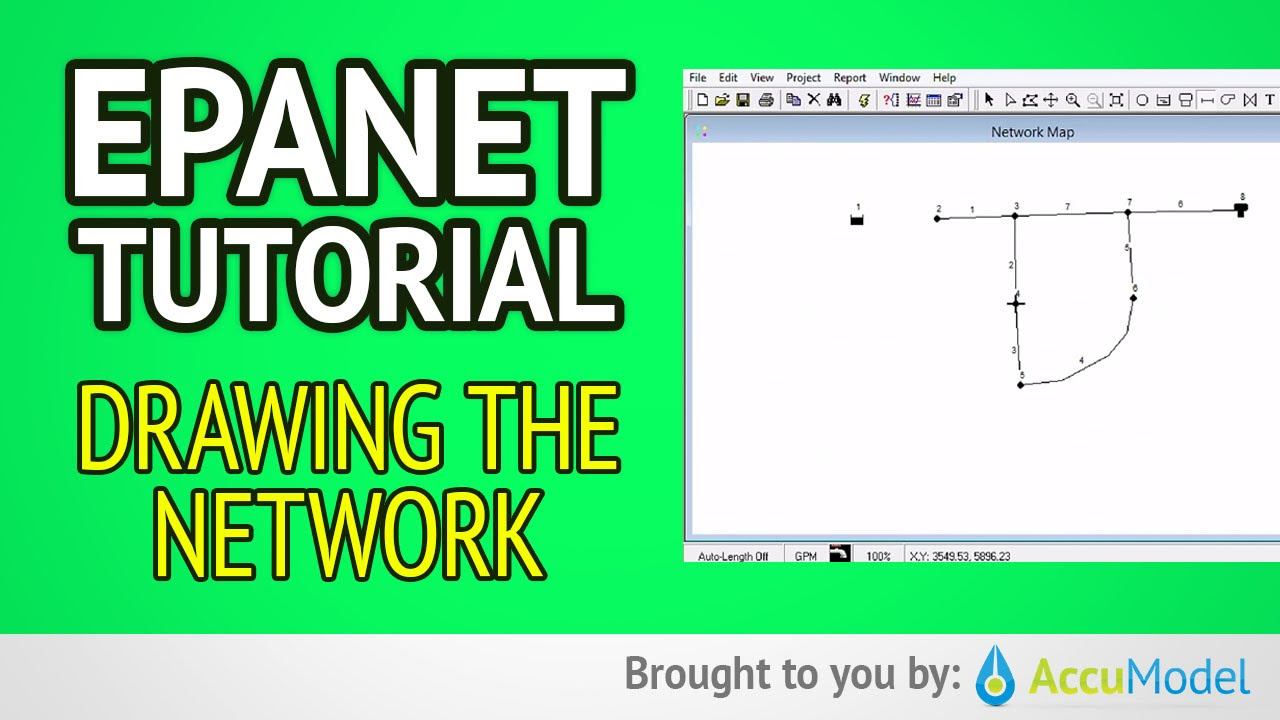
EPANET Tutorial 02.06 - Saving and Opening Projects | Hydraulic Modeling
EPANET Tutorial 01 - Overview of EPANET | Hydraulic Modeling
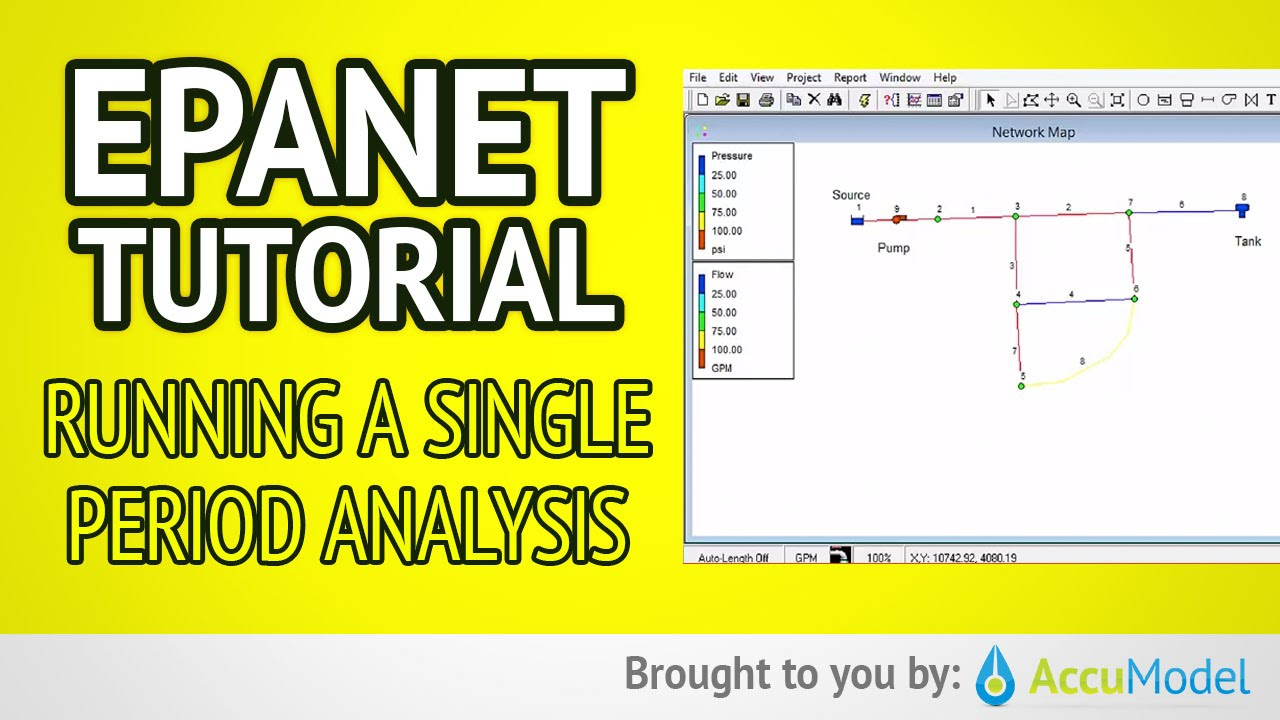
EPANET Tutorial 02.07 - Running a Single Period Analysis | Hydraulic Modeling
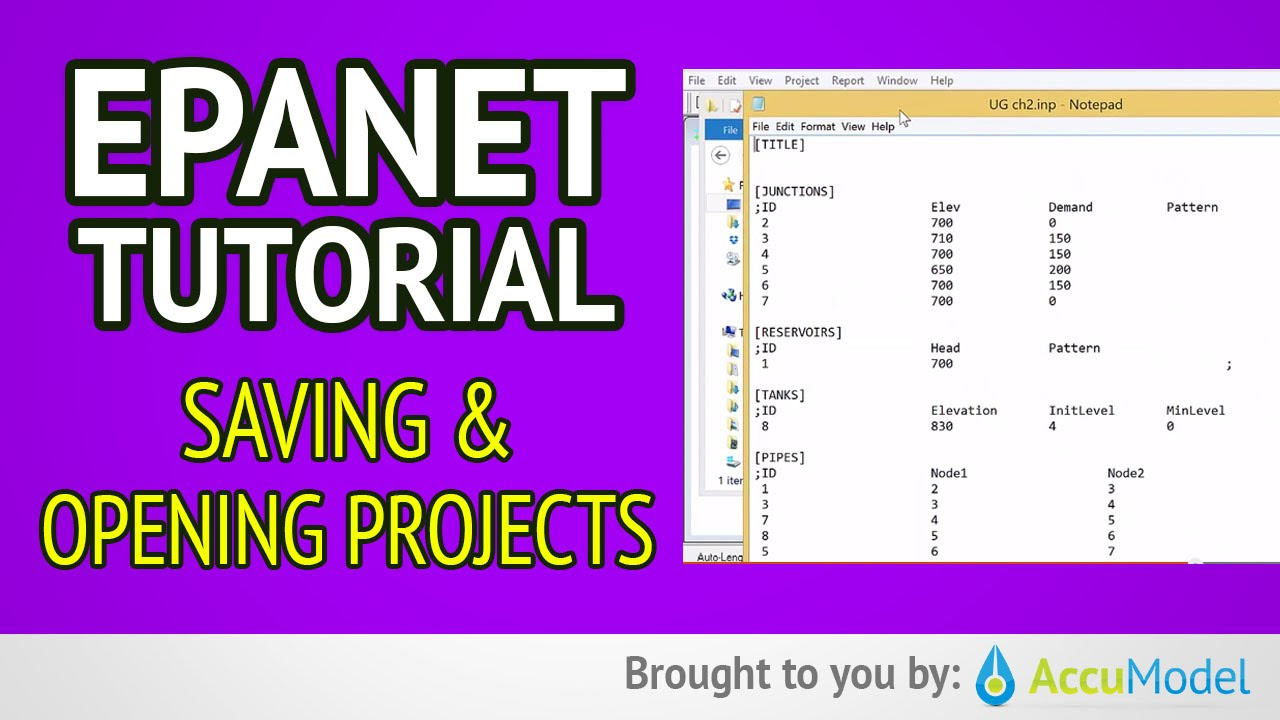
Particle Disintegration Simulation with Geometry Nodes | Blender 3.5 Tutorial
5.0 / 5 (0 votes)