How to Read and Interpret the IR Spectra | Step-by-Step Guide to IR Spectroscopy
Summary
TLDRIn this practical guide to IR spectroscopy, Victor breaks down key concepts, such as wave numbers, signal shapes, and strengths, to help students solve exam questions efficiently. He focuses on interpreting the analytical region of the IR spectrum, teaching viewers to recognize functional groups like alcohols, ketones, and carbonyls. Emphasizing the importance of consistent practice, Victor encourages viewers to solve multiple problems daily to improve their spectroscopy skills. With practical tips, a clear approach, and a reference table, this video equips students with the tools they need to confidently decode IR spectra and perform well on exams.
Takeaways
- 😀 IR spectroscopy helps identify functional groups in a molecule by analyzing how they absorb infrared light at different frequencies.
- 😀 The IR spectrum has two main regions: the fingerprint region (below 1500 cm⁻¹) and the analytical region (above 1500 cm⁻¹). Focus on the analytical region for practical interpretation.
- 😀 The wave number in IR spectroscopy is related to the vibrational frequency of bonds. Higher wave numbers correspond to higher vibrational energies.
- 😀 The shape of signals is important: broad and smooth signals typically indicate O-H groups, while sharp signals indicate N-H groups.
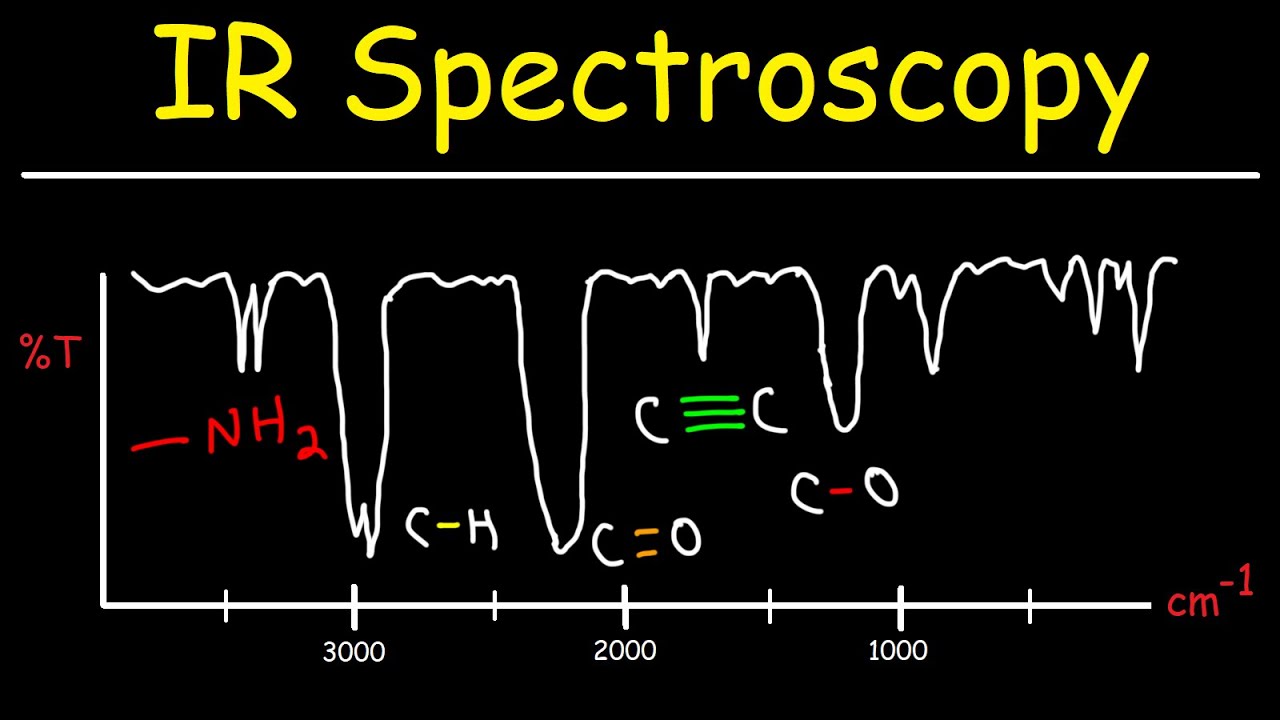
- 😀 Signals around 2950 cm⁻¹ indicate sp³ hybridized C-H stretches, while signals around 3050 cm⁻¹ are associated with sp² hybridized C-H stretches.
- 😀 Triple bonds typically show signals around 3300 cm⁻¹ for terminal bonds (sp hybridized C-H stretches). These signals can be weak or disappear in non-terminal cases.
- 😀 Functional groups like C=O and C=C have characteristic signals in the 1600–1700 cm⁻¹ range, which can help identify ketones, aldehydes, or alkenes.
- 😀 The fingerprint region is unique to each molecule, but it is not crucial for most IR analyses unless identifying a specific compound by comparison.
- 😀 Signal strength can vary depending on how the spectrum was collected but is less important than the position and shape of the signals.
- 😀 To become proficient in solving IR spectroscopy problems, consistent practice is essential. Memorize key numbers and solve problems regularly to improve your skills.
Q & A
What is the primary purpose of infrared (IR) spectroscopy in organic chemistry?
-IR spectroscopy is used to identify and analyze functional groups in organic molecules by observing how they absorb infrared light. Different bonds vibrate at specific frequencies, which can be detected in the IR spectrum.
What is the difference between the fingerprint region and the analytical region in an IR spectrum?
-The fingerprint region is below 1500 cm⁻¹ and is typically used to identify molecules by comparing spectra. The analytical region, above 1500 cm⁻¹, is where functional group identification occurs, and it provides the most useful information for solving exam problems.
Why is the analytical region considered more important than the fingerprint region for IR spectroscopy exams?
-The analytical region provides clear signals for identifying functional groups, such as O-H, N-H, C=O, and C-H stretches, which are crucial for solving exam problems. The fingerprint region is complex and not typically used unless for molecular identification.
What does the wave number in an IR spectrum indicate?
-The wave number is related to the vibrational frequency of bonds within a molecule. It is directly proportional to the energy of the vibration. Higher wave numbers correspond to higher vibrational energies of bonds.
How can the shape of a signal in an IR spectrum help identify a functional group?
-The shape of a signal reveals characteristics about the functional group. For example, a broad and smooth signal around 3300 cm⁻¹ indicates an O-H group, while a sharp and weak signal suggests an N-H group. The shape helps differentiate between similar functional groups.
What is the significance of the 3000 cm⁻¹ region in an IR spectrum?
-The region around 3000 cm⁻¹ is important because it marks the C-H stretching frequencies. Signals just under 3000 cm⁻¹ indicate sp³ hybridized C-H bonds (alkyl groups), while signals just above 3000 cm⁻¹ indicate sp² hybridized C-H bonds (alkenes or aromatics).
What can you conclude from a sharp spike around 3300 cm⁻¹ in an IR spectrum?
-A sharp spike around 3300 cm⁻¹ typically indicates an sp hybridized C-H stretch, which is seen in terminal alkyne (triple bond) groups.
Why is the carbonyl stretch (C=O) at around 1700 cm⁻¹ so significant in IR spectroscopy?
-The C=O stretch around 1700 cm⁻¹ is a prominent feature for identifying carbonyl-containing functional groups, such as aldehydes, ketones, carboxylic acids, and esters, making it crucial for determining molecular structure.
What should you focus on when interpreting an IR spectrum for an exam?
-For exams, focus on the wave number positions and signal shapes in the analytical region. These will help identify functional groups. It's essential to practice solving spectra problems and become familiar with common wave numbers for various functional groups.
How does practicing IR spectroscopy problems help students prepare for exams?
-By practicing IR spectroscopy problems, students improve their ability to quickly identify functional groups and interpret spectra under exam conditions. It builds familiarity with common wave numbers and allows students to apply theoretical knowledge to real-world problems.
Outlines

Esta sección está disponible solo para usuarios con suscripción. Por favor, mejora tu plan para acceder a esta parte.
Mejorar ahoraMindmap

Esta sección está disponible solo para usuarios con suscripción. Por favor, mejora tu plan para acceder a esta parte.
Mejorar ahoraKeywords

Esta sección está disponible solo para usuarios con suscripción. Por favor, mejora tu plan para acceder a esta parte.
Mejorar ahoraHighlights

Esta sección está disponible solo para usuarios con suscripción. Por favor, mejora tu plan para acceder a esta parte.
Mejorar ahoraTranscripts

Esta sección está disponible solo para usuarios con suscripción. Por favor, mejora tu plan para acceder a esta parte.
Mejorar ahoraVer Más Videos Relacionados

Interpretation of IR Spectra
IR Spectroscopy - Basic Introduction

The Electromagnetic Spectrum Introduction | Study Chemistry With Us

Persamaan Gelombang Berjalan

Introduction to infrared spectroscopy | Spectroscopy | Organic chemistry | Khan Academy

How to Interpret an IR Spectrum and Identify the RIGHT Functional Group
5.0 / 5 (0 votes)
