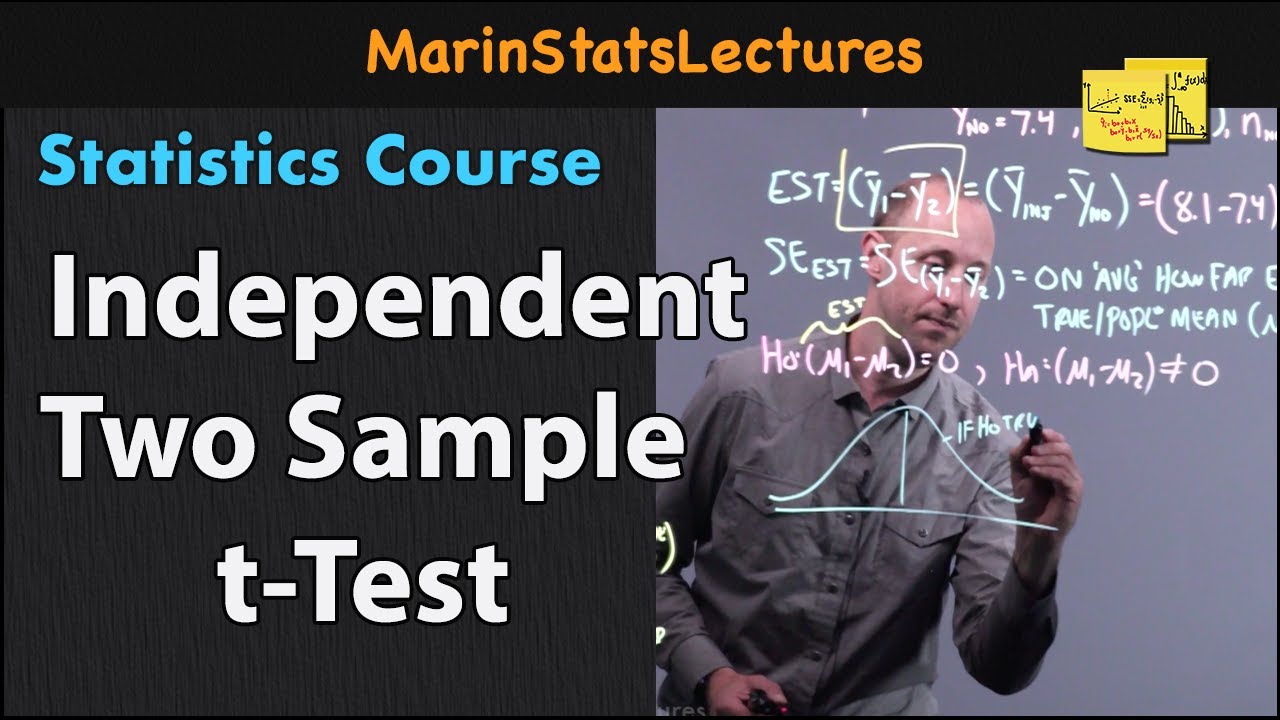
Hypothesis Testing 2 (Two Sample Mean)
Summary
TLDRThis lecture continues the discussion on hypothesis testing, focusing on comparing the means of two independent samples. Using a practical example of University A and University B, the instructor demonstrates step-by-step how to perform a two-sample t-test with equal variances, including stating hypotheses, determining significance level, calculating pooled variance, computing the test statistic, and interpreting results. Emphasis is placed on correctly identifying critical values, degrees of freedom, and the rejection region. By the end, students learn how to conclude whether the difference in sample means is statistically significant, reinforcing concepts through a detailed, real-world example.
Takeaways
- 😀 The session is a continuation of hypothesis testing, focusing on comparing means between two samples.
- 😀 A two-sample t-test is used when sample sizes are less than 30 and population variances are assumed equal.
- 😀 Null hypothesis (H0) always assumes that the means of the two groups are equal.
- 😀 Alternative hypothesis (H1) is based on whether the means are significantly different.
- 😀 Significance level (alpha) is set at 0.05 for testing.
- 😀 Degrees of freedom for the t-test are calculated as the sum of sample sizes minus 2 (nA + nB - 2).
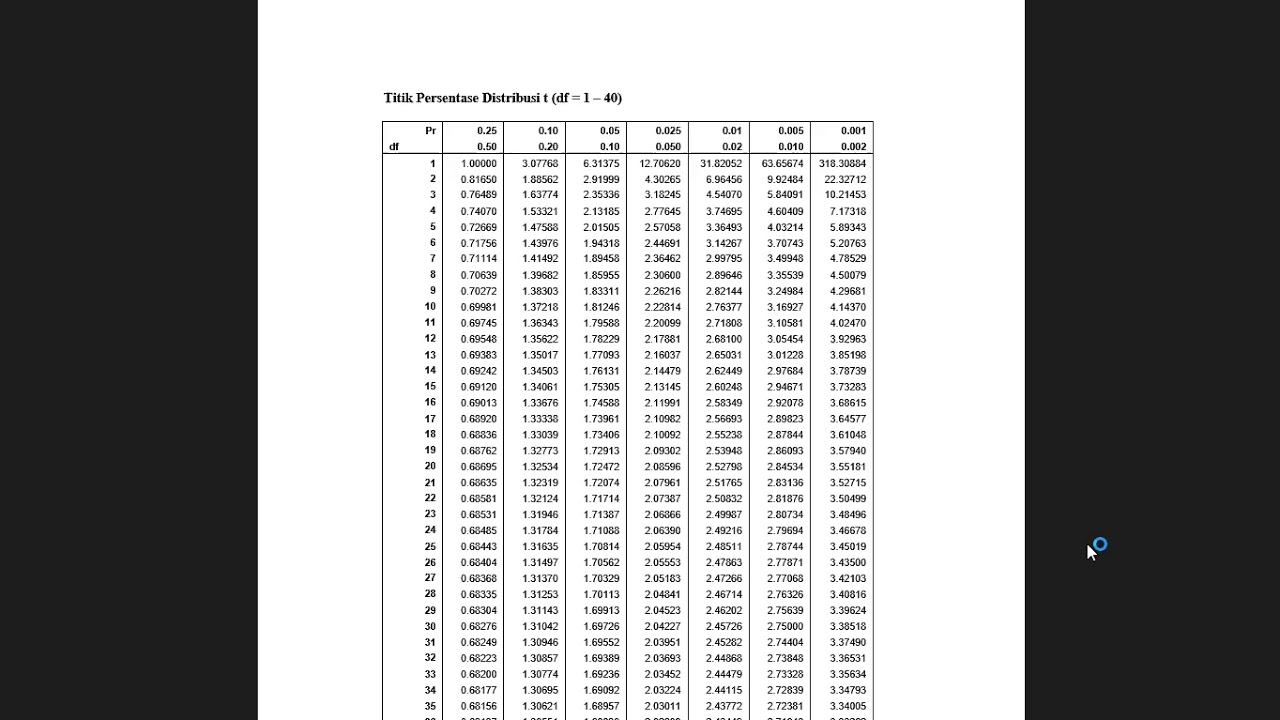
- 😀 The critical t-value is obtained from the t-distribution table using the calculated degrees of freedom and alpha/2 for two-tailed tests.
- 😀 The test statistic is calculated using the pooled standard deviation and the difference between sample means.
- 😀 Decision rule: Reject H0 if the absolute value of the test statistic exceeds the critical t-value.
- 😀 Conclusion is stated in plain language: sufficient evidence indicates that the mean performance between University A and University B students is significantly different.
- 😀 Key assumptions include normality of data and equality of variances, which are necessary for the validity of the test.
Q & A
What is the main topic of the lecture in the transcript?
-The lecture focuses on hypothesis testing for comparing the means of two independent samples, particularly when sample sizes are small and variances are assumed equal.
What are the assumptions made for the t-test in this example?
-The assumptions are: (1) the sample scores are normally distributed, (2) the population variances are equal, and (3) the samples are independent.
What are the null and alternative hypotheses for this two-sample test?
-Null hypothesis (H0): μ1 = μ2 (the means of University A and University B are equal). Alternative hypothesis (H1): μ1 ≠ μ2 (the means are significantly different).
How is the degrees of freedom calculated for the t-test with two samples?
-Degrees of freedom (df) is calculated as df = n1 + n2 - 2. In this example, df = 20 + 22 - 2 = 40.
What is the significance level (alpha) used in this example, and why is it important?
-The significance level is α = 0.05. It represents the probability of rejecting the null hypothesis when it is actually true and is used to determine the critical value for the test.
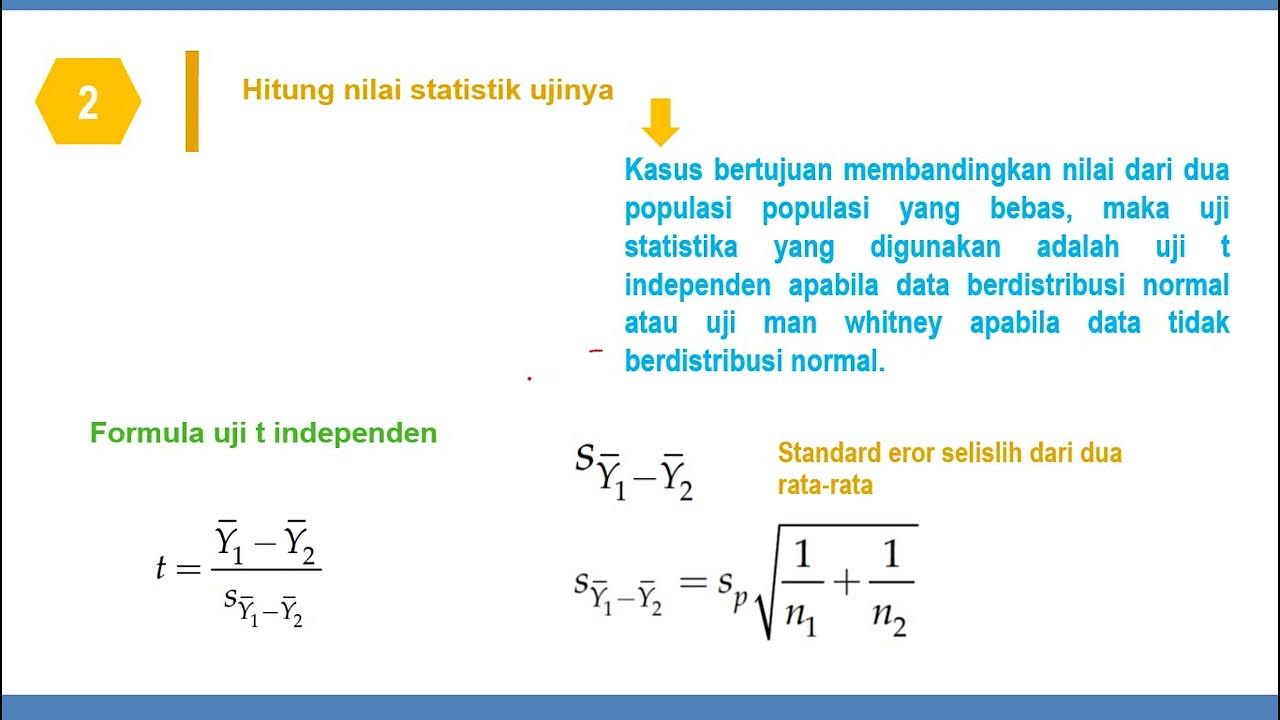
What formula is used to calculate the pooled standard deviation?
-The pooled variance formula is: sp^2 = [(n1-1)s1^2 + (n2-1)s2^2] / (n1 + n2 - 2). The square root of sp^2 gives the pooled standard deviation sp.
How is the t-test statistic for two independent samples with equal variances calculated?
-The t statistic is calculated as t = (x̄1 - x̄2) / (sp * √(1/n1 + 1/n2)), where x̄1 and x̄2 are the sample means, n1 and n2 are the sample sizes, and sp is the pooled standard deviation.
What is the critical t-value for this test, and how is it determined?
-The critical t-value is t0.025,40 ≈ 2.021, determined from the t-distribution table for a two-tailed test with α/2 = 0.025 and 40 degrees of freedom.
Based on the calculated t statistic, what decision is made regarding the null hypothesis?
-The calculated t statistic is -2.18. Since |t| = 2.18 > tcritical = 2.021, the null hypothesis is rejected, indicating a significant difference between the means.
How should the conclusion be stated after performing the t-test?
-The conclusion should be stated in sentence form: 'At α = 0.05, there is sufficient evidence to show that the performance of students in University A and University B is significantly different.'
Why is it important not to confuse the calculated t statistic with the critical t-value?
-The calculated t statistic is based on the sample data, while the critical t-value is determined from statistical tables. Confusing them can lead to incorrect decisions regarding rejecting or failing to reject H0.
What should be done if the sample sizes were larger than 30?
-If sample sizes are larger than 30, the z-test can be used instead of the t-test because the sampling distribution of the mean approaches normality according to the Central Limit Theorem.
Outlines

Esta sección está disponible solo para usuarios con suscripción. Por favor, mejora tu plan para acceder a esta parte.
Mejorar ahoraMindmap

Esta sección está disponible solo para usuarios con suscripción. Por favor, mejora tu plan para acceder a esta parte.
Mejorar ahoraKeywords

Esta sección está disponible solo para usuarios con suscripción. Por favor, mejora tu plan para acceder a esta parte.
Mejorar ahoraHighlights

Esta sección está disponible solo para usuarios con suscripción. Por favor, mejora tu plan para acceder a esta parte.
Mejorar ahoraTranscripts

Esta sección está disponible solo para usuarios con suscripción. Por favor, mejora tu plan para acceder a esta parte.
Mejorar ahoraVer Más Videos Relacionados


5.0 / 5 (0 votes)
