Graphing quadratic inequalities unit 2 day something
Summary
TLDRThis video provides a detailed walkthrough of graphing and analyzing quadratic functions in vertex, standard, and intercept forms. It demonstrates plotting points, finding vertices using formulas, converting between forms, and factoring. The instructor also applies these concepts to a real-world example, modeling a basketball shot to determine maximum height and time to reach it. Additionally, the video covers graphing quadratic inequalities, explaining line types, shading solutions, and using test points. Clear step-by-step explanations, visual strategies, and practical examples help learners understand how to accurately represent, interpret, and solve quadratic functions and inequalities.
Takeaways
- 😀 Vertex form of a quadratic function is written as y = a(x - h)^2 + k, where (h, k) is the vertex of the parabola.
- 😀 When graphing from vertex form, you can move horizontally by 'h' units and vertically by 'k' units to plot the vertex.
- 😀 In vertex form, the coefficient 'a' determines the direction and steepness of the parabola: a > 0 means it opens upwards, and a < 0 means it opens downwards.
- 😀 Standard form of a quadratic equation is y = ax^2 + bx + c, and the vertex can be found using the formula x = -b / (2a).
- 😀 To find the y-coordinate of the vertex in standard form, substitute the x-coordinate into the quadratic equation.
- 😀 Intercept form of a quadratic is y = a(x - p)(x - q), and it is useful for easily identifying the x-intercepts of the graph.
- 😀 The vertex of a parabola represents either the maximum or minimum value, depending on whether it opens up or down.
- 😀 The process of completing the square can help convert a quadratic equation into vertex form.
- 😀 In graphing quadratic inequalities, use a solid line for 'equal to' (≤, ≥) and a dotted line for strict inequalities (<, >).
- 😀 For quadratic inequalities, after graphing the line, shade the region that satisfies the inequality using a test point to determine which side to shade.
Q & A
What is the vertex form of a quadratic function and how is the vertex identified?
-The vertex form of a quadratic function is y = a(x-h)^2 + k, where (h, k) is the vertex. The vertex is identified directly from h and k in the equation.
How do you plot points around the vertex using the 'pattern' method?
-From the vertex, you use the a-value pattern (e.g., 1, 3, 5) to move right and left by 1 unit in x, then up or down by the pattern values in y, creating a symmetrical set of points.
How do you find the vertex of a quadratic in standard form?
-For y = ax^2 + bx + c, the x-coordinate of the vertex is found using x = -b/(2a). Substitute this x-value into the equation to find the y-coordinate.
What are the steps to convert a quadratic from vertex form to standard form?
-To convert from vertex form to standard form, expand (x-h)^2 + k, simplify by combining like terms, and adjust coefficients accordingly to match the standard form y = ax^2 + bx + c.
How can you determine the intercept form from vertex or standard form?
-To convert to intercept form y = a(x-p)(x-q), factor the quadratic if possible. If the quadratic has a repeated root, the intercept form may have the same factor twice, e.g., a(x-4)(x-4).
How is the maximum height and time of a projectile determined from a quadratic equation?
-For a projectile h(t) = -16t^2 + 32t + 6, the maximum height occurs at the vertex. Use t = -b/(2a) to find the time, then substitute that t into the equation to find the height.
What is the significance of the starting point in a projectile motion problem?
-The starting point indicates the initial height of the projectile at t = 0. It is important for symmetry, as the projectile will return to this height at a later time.
What are the rules for graphing quadratic inequalities?
-Use a solid line for ≤ or ≥ and a dotted line for < or >. Then, use a test point to determine which side of the parabola to shade. Points on the shaded region satisfy the inequality.
How do you determine which region to shade when graphing inequalities?
-Choose a test point not on the parabola, often (0,0). Substitute it into the inequality. If true, shade the region containing the test point; if false, shade the opposite side.
Why are arrowheads important when graphing parabolas?
-Arrowheads indicate that the parabola continues indefinitely in both directions. Without them, the graph could be misinterpreted as being limited to just the plotted points.
How do symmetry and the axis of symmetry help when analyzing quadratic graphs?
-The axis of symmetry passes through the vertex and divides the parabola into mirror-image halves. This helps identify corresponding points and understand projectile motion or shading in inequalities.
What is the significance of using the test point (0,0) in graphing inequalities?
-Using (0,0) simplifies calculations since substituting x=0 and y=0 often reduces the equation to a single number, making it easier to determine whether to shade above or below the parabola.
Outlines

Esta sección está disponible solo para usuarios con suscripción. Por favor, mejora tu plan para acceder a esta parte.
Mejorar ahoraMindmap

Esta sección está disponible solo para usuarios con suscripción. Por favor, mejora tu plan para acceder a esta parte.
Mejorar ahoraKeywords

Esta sección está disponible solo para usuarios con suscripción. Por favor, mejora tu plan para acceder a esta parte.
Mejorar ahoraHighlights

Esta sección está disponible solo para usuarios con suscripción. Por favor, mejora tu plan para acceder a esta parte.
Mejorar ahoraTranscripts

Esta sección está disponible solo para usuarios con suscripción. Por favor, mejora tu plan para acceder a esta parte.
Mejorar ahoraVer Más Videos Relacionados
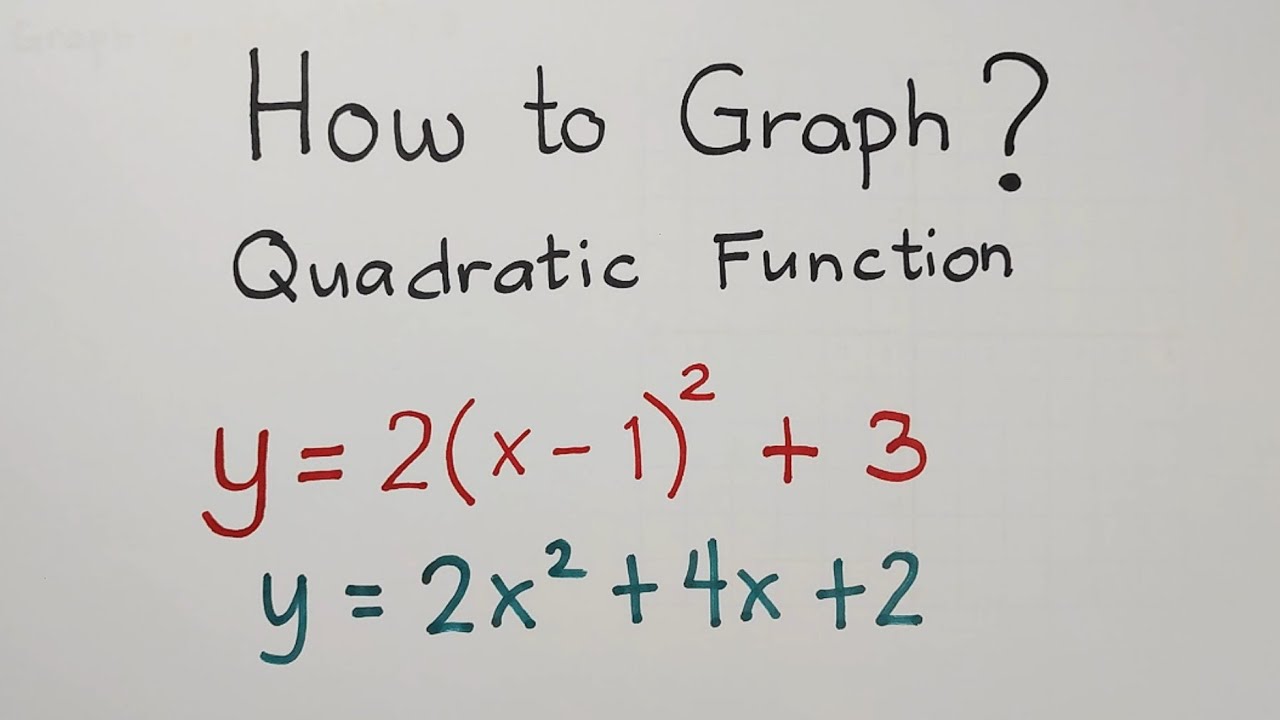
How to Graph a Quadratic Function? Quadratic Function, Vertex, Axis of Symmetry and Parabola
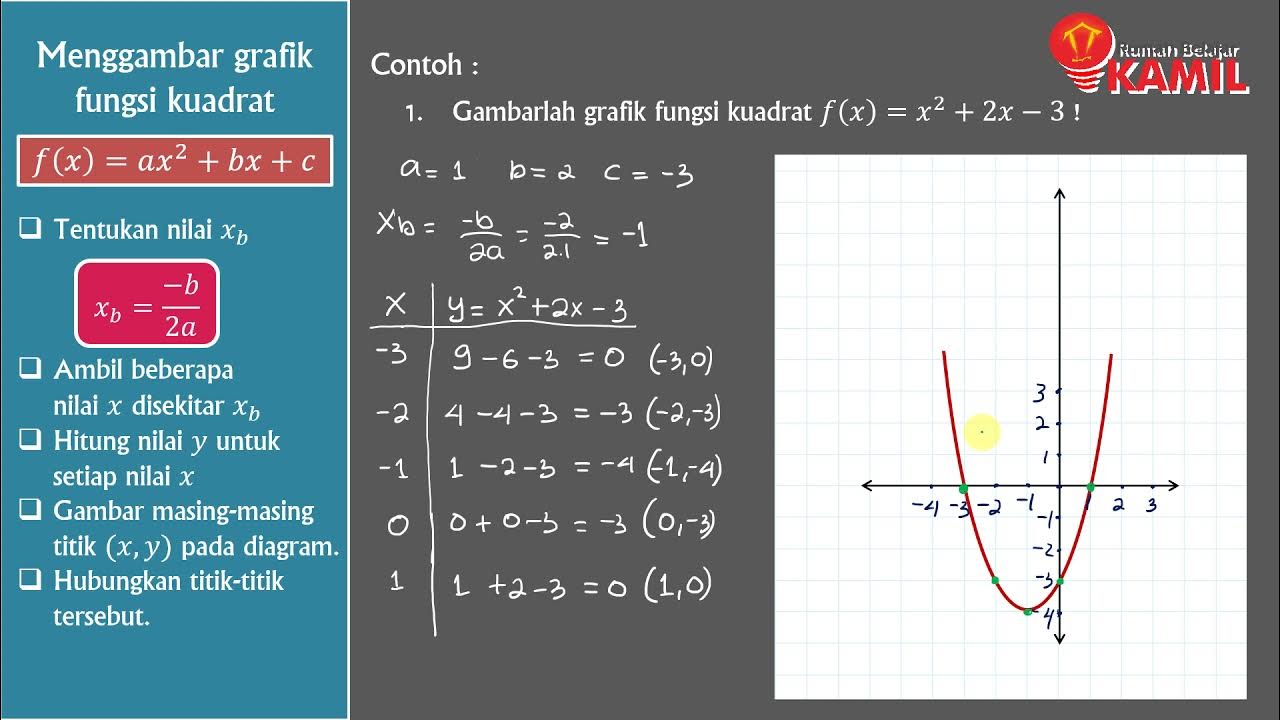
Matematika Kelas 9 : Fungsi Kuadrat (Part 3 : Menggambar grafik fungsi kuadrat)
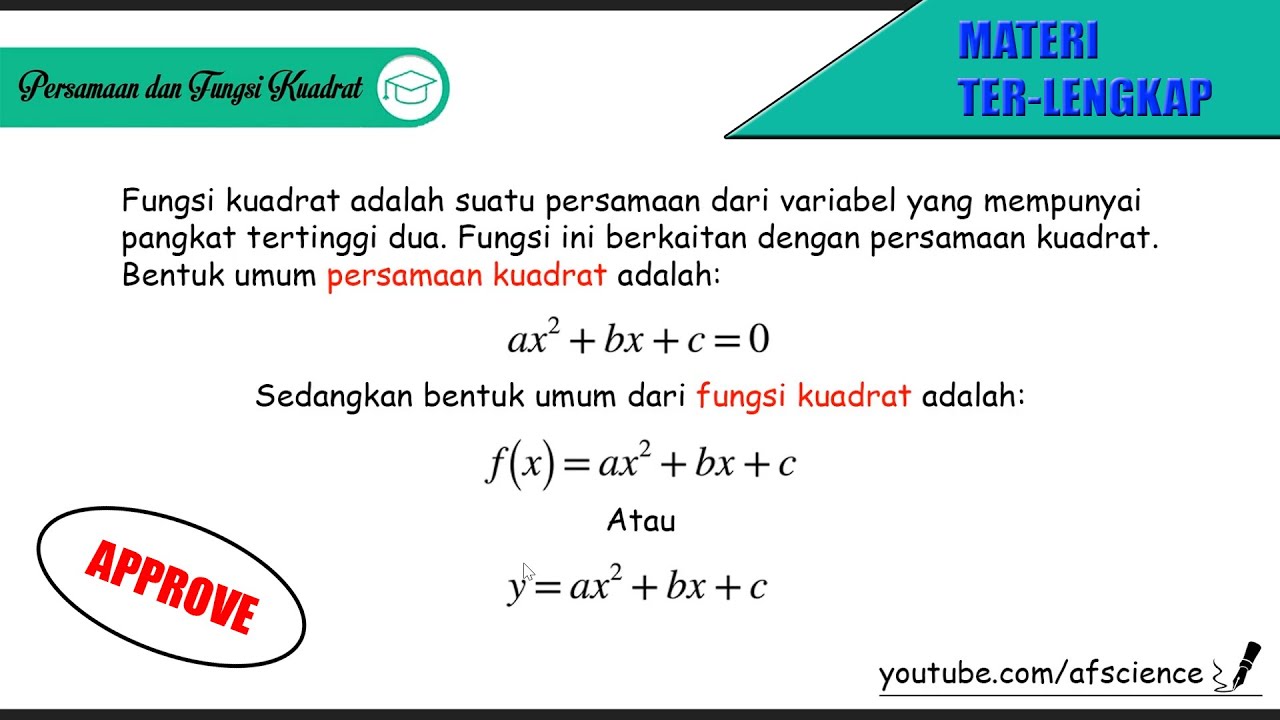
Persamaan dan Fungsi Kuadrat (Materi LENGKAP)

Mudah Banget! Cara Menggambar dan Membaca Grafik Fungsi Kuadrat
Fungsi Kuadrat Bagian 1 - Matematika Wajib Kelas X m4thlab
Cara mudah menggambarkan grafik fungsi kuadrat
5.0 / 5 (0 votes)
