MEAN, MEDIAN AND MODE OF GROUPED DATA || GRADE 10 MATHEMATICS Q4
Summary
TLDRIn this tutorial, the video explains how to compute the mean, median, and mode of grouped data using specific formulas. The presenter walks through an example of calculating these measures for the heights of 40 grade 10 students. The process includes understanding key terms such as frequency, class mark, cumulative frequency, and class width. Through detailed steps, the tutorial demonstrates how to use the relevant formulas for each measure of central tendency, providing an easy-to-follow guide for students and learners looking to grasp the concept of group data analysis.
Takeaways
- 😀 Group data refers to data arranged into a frequency distribution, used when dealing with large numbers of elements.
- 😀 The three key measures of central tendency for group data are the mean, median, and mode.
- 😀 To compute the mean of group data, multiply the frequency by the class mark, sum the products, and divide by the total frequency.
- 😀 The formula for the median of group data involves the lower boundary, the cumulative frequency, and the class width.
- 😀 The formula for the mode of group data uses the lower boundary of the modal class and the frequency differences of the modal class and its neighboring classes.
- 😀 For computing the mean, the symbol 'f' represents the frequency, 'x' represents the class mark, and 'n' is the total frequency.
- 😀 The median class is determined using the cumulative frequency and the position where half the total frequency lies.
- 😀 The mode is calculated by finding the class with the highest frequency, then determining the differences in frequency between the modal class and its neighbors.
- 😀 The class mark is calculated by adding the upper and lower class limits and dividing by two.
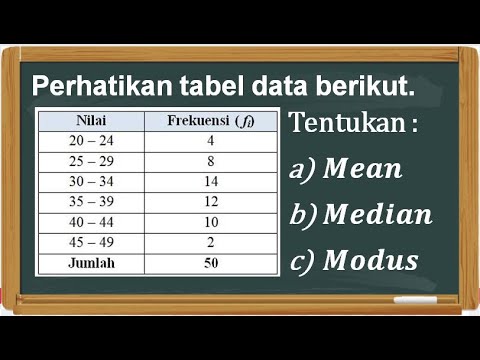
- 😀 The median value of group data in the example was calculated as 147.75, while the mode was 147.2, showcasing how central tendency measures are applied to real-world data.
Q & A
What is the main focus of the video lesson?
-The main focus of the video is to teach how to calculate the mean, median, and mode of grouped data, which is data organized into frequency distributions.
What is 'group data' in the context of the video?
-Group data refers to data that is organized into a frequency distribution, especially when the number of elements is too large for individual calculation.
What does the symbol 'f' represent in the formula for the mean?
-'f' represents the frequency of each class in the frequency distribution.
What does 'x' stand for in the mean formula for grouped data?
-'x' stands for the class mark, which is the midpoint of each class interval in the frequency distribution.
How is the class mark 'x' calculated?
-The class mark is calculated by adding the lower limit and the upper limit of a class, then dividing the sum by 2.
What is the formula to calculate the median for grouped data?
-The formula for the median is: Median = L + [(n/2 - CF) / f] * h, where L is the lower boundary of the median class, CF is the cumulative frequency before the median class, f is the frequency of the median class, and h is the class width.
What does 'CF' stand for in the median formula?
-CF stands for the cumulative frequency before the median class, which is the sum of frequencies for all classes preceding the median class.
How is the mode of grouped data calculated?
-The mode is calculated using the formula: Mode = L + [(f1 - f0) / (2f1 - f0 - f2)] * h, where L is the lower boundary of the modal class, f1 is the frequency of the modal class, f0 is the frequency of the class before it, f2 is the frequency of the class after it, and h is the class width.
Why is the frequency distribution important when calculating measures of central tendency?
-Frequency distributions are important because they allow for efficient calculation of measures of central tendency when the dataset is large. Without the frequency distribution, handling large data sets becomes cumbersome.
In the example provided in the video, what is the total frequency 'n'?
-In the example, the total frequency 'n' is 40, which is the sum of all the frequencies of the different classes.
What were the final values of the mean, median, and mode in the example?
-The final values in the example were: Mean = 147, Median = 147.75, and Mode = 147.2.
Outlines

Esta sección está disponible solo para usuarios con suscripción. Por favor, mejora tu plan para acceder a esta parte.
Mejorar ahoraMindmap

Esta sección está disponible solo para usuarios con suscripción. Por favor, mejora tu plan para acceder a esta parte.
Mejorar ahoraKeywords

Esta sección está disponible solo para usuarios con suscripción. Por favor, mejora tu plan para acceder a esta parte.
Mejorar ahoraHighlights

Esta sección está disponible solo para usuarios con suscripción. Por favor, mejora tu plan para acceder a esta parte.
Mejorar ahoraTranscripts

Esta sección está disponible solo para usuarios con suscripción. Por favor, mejora tu plan para acceder a esta parte.
Mejorar ahoraVer Más Videos Relacionados
Menentukan Mean, Median, dan Modus Data Kelompok

Cara menyusun tabel distribusi frekuensi, menentukan mean, median dan modus data kelompok

STATISTIKA CARA MENCARI NILAI MEAN, MEDIAN, MODUS DATA KELOMPOK PART 1

Statistika Dasar Ukuran Pemusatan Data (Mean, Modus, Median) Data Tunggal dan Data Kelompok

Measure of Central Tendency of Grouped Data for beginners
Statistika - Ukuran Pemusatan Data (Mean, Median, Modus)
5.0 / 5 (0 votes)
