Quadratic Functions, How to Graph Quadratic Functions, Quadratic Function Graph
Summary
TLDRThis educational video explains how to graph a quadratic function, focusing on key points such as intersections with the x-axis and y-axis, turning points, and the axis of symmetry. The lesson covers the process of plotting a quadratic curve by calculating corresponding y-values for given x-values. It also introduces important formulas, such as the axis of symmetry and the vertex of the parabola. By following step-by-step examples, viewers learn how to sketch quadratic functions and identify crucial points, helping them understand how the graph is shaped and how to interpret its key features.
Takeaways
- 😀 Quadratic functions can be graphed on a Cartesian coordinate system, with the x-axis representing the input values and the y-axis representing the output values.
- 😀 The general shape of the graph of a quadratic function is a parabola, which can either open upwards or downwards depending on the coefficients.
- 😀 Key points on a quadratic graph include the intersection points with the x-axis, the intersection with the y-axis, the turning point (vertex), and the axis of symmetry.
- 😀 To graph a quadratic function, first calculate several x and y values by substituting different x-values into the function, then plot the corresponding points.
- 😀 The equation for the axis of symmetry is given by x = -b/2a, where 'a' and 'b' are the coefficients from the standard form of the quadratic equation.
- 😀 The turning point or vertex of the graph is located on the axis of symmetry, and its y-coordinate can be found using the formula y = -b²/4a.
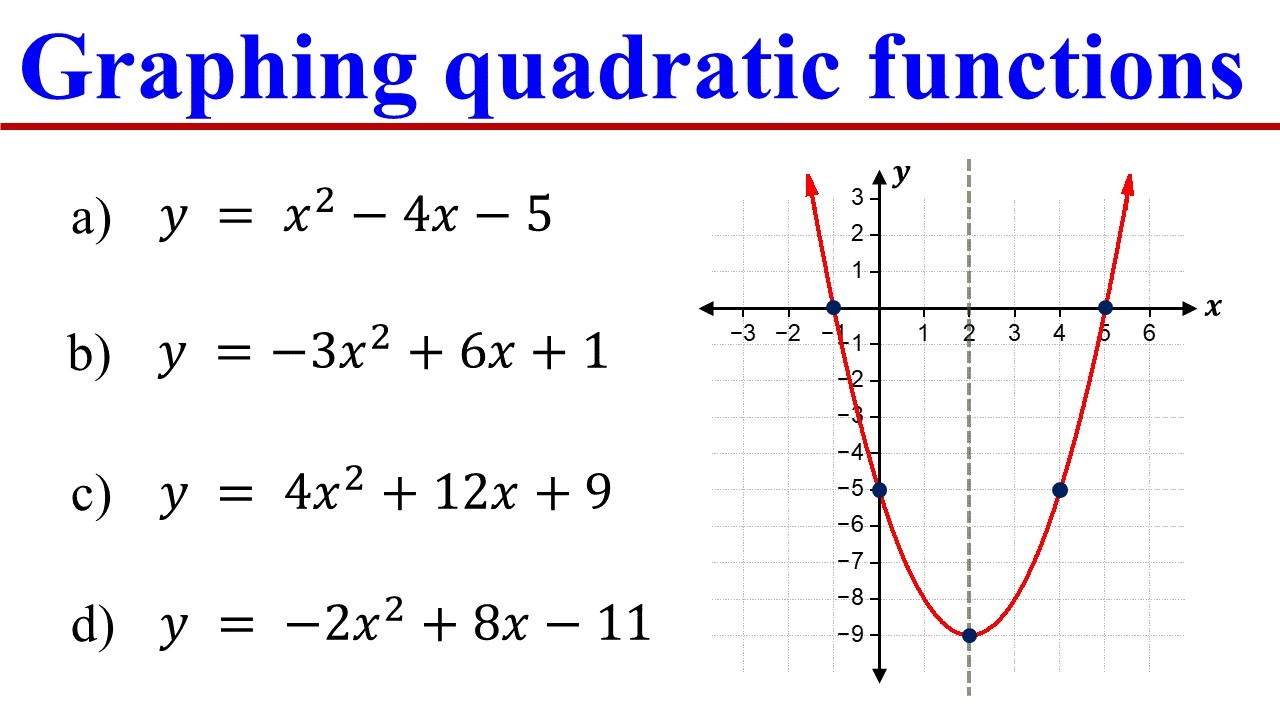
- 😀 For the function f(x) = x² - 2x - 3, important points include intersections at (-1, 0) and (3, 0) with the x-axis, and (0, -3) with the y-axis.
- 😀 The process of factoring a quadratic equation helps in determining the x-intercepts (roots) of the graph, which are the points where the graph crosses the x-axis.
- 😀 To find the y-intercept, substitute x = 0 into the quadratic function and solve for y.
- 😀 When sketching a quadratic function, it’s important to check for symmetry and ensure that the graph's curve mirrors across the axis of symmetry.
- 😀 If the function has a negative coefficient in front of the x² term, the parabola will open downward, and if positive, it will open upward.
Q & A
What is a quadratic function?
-A quadratic function is a type of polynomial function that can be written in the form y = ax² + bx + c, where 'a', 'b', and 'c' are constants, and 'a' is not equal to 0. It represents a parabola when graphed.
How can the graph of a quadratic function be described?
-The graph of a quadratic function is a parabola. It can open upwards if the coefficient 'a' is positive and downwards if 'a' is negative. The graph has a vertex (maximum or minimum point), an axis of symmetry, and intersections with both the x-axis and y-axis.
What are the key points in the graph of a quadratic function?
-The key points in the graph of a quadratic function include the intersection points with the x-axis (also called the x-intercepts), the intersection point with the y-axis (the y-intercept), the turning point (vertex), and the axis of symmetry.
What is the axis of symmetry in the graph of a quadratic function?
-The axis of symmetry is a vertical line that divides the parabola into two symmetrical halves. The equation of the axis of symmetry is given by x = -b/2a, where 'a' and 'b' are the coefficients from the quadratic function y = ax² + bx + c.
How do you find the vertex of a quadratic function?
-The vertex of a quadratic function can be found using the formula x = -b/2a to determine the x-coordinate. Once the x-coordinate is known, substitute it into the quadratic function to find the corresponding y-coordinate.
How do you find the x-intercepts of a quadratic function?
-To find the x-intercepts of a quadratic function, set y = 0 and solve for x in the equation ax² + bx + c = 0. The solutions to this equation represent the points where the graph intersects the x-axis.
How do you find the y-intercept of a quadratic function?
-To find the y-intercept of a quadratic function, set x = 0 in the equation y = ax² + bx + c. The resulting value of y is the y-intercept, which is the point where the graph intersects the y-axis.
What is the general process to graph a quadratic function?
-To graph a quadratic function, first calculate several x-values, substitute them into the quadratic equation to find the corresponding y-values, and plot these points on the graph. Then, draw a smooth curve through the points to form the parabola.
What does it mean when a quadratic function opens upwards or downwards?
-If the coefficient 'a' in the quadratic function y = ax² + bx + c is positive, the parabola opens upwards, meaning the vertex is the minimum point. If 'a' is negative, the parabola opens downwards, meaning the vertex is the maximum point.
How do you solve for the maximum or minimum value of a quadratic function?
-The maximum or minimum value of a quadratic function can be found by calculating the value of the function at the vertex. The vertex occurs at x = -b/2a. Substitute this x-value into the quadratic function to find the corresponding y-value, which is the maximum or minimum value.
Outlines

Esta sección está disponible solo para usuarios con suscripción. Por favor, mejora tu plan para acceder a esta parte.
Mejorar ahoraMindmap

Esta sección está disponible solo para usuarios con suscripción. Por favor, mejora tu plan para acceder a esta parte.
Mejorar ahoraKeywords

Esta sección está disponible solo para usuarios con suscripción. Por favor, mejora tu plan para acceder a esta parte.
Mejorar ahoraHighlights

Esta sección está disponible solo para usuarios con suscripción. Por favor, mejora tu plan para acceder a esta parte.
Mejorar ahoraTranscripts

Esta sección está disponible solo para usuarios con suscripción. Por favor, mejora tu plan para acceder a esta parte.
Mejorar ahoraVer Más Videos Relacionados

Mudah Banget! Cara Menggambar dan Membaca Grafik Fungsi Kuadrat
How to Graph Quadratic Functions by finding the Vertex, Axis of symmetry, X & Y intercepts
Fungsi Kuadrat Bagian 1 - Matematika Wajib Kelas X m4thlab
FUNGSI KUADRAT
How to Graph a Quadratic Function? Quadratic Function, Vertex, Axis of Symmetry and Parabola
matematika kelas 9 | Refleksi/Pencerminan terhadap sumbu-Y
5.0 / 5 (0 votes)
