Tutorial Analisis Potensi Air Tanah (By : Elva Ni'matal Ummah)
Summary
TLDRIn this tutorial, Elfani from the Geography Program teaches viewers how to create a groundwater potential map using ArcMap and satellite data. The video covers the definition of groundwater, its importance, and the NDWI (Normalized Difference Water Index) method for analysis. Elfani demonstrates the step-by-step process of importing Landsat 8 imagery, applying NDWI calculations, clipping data to the study area, and symbolizing the map with color-coded categories. The video emphasizes the significance of groundwater potential analysis for decision-making, policy development, and sustainable resource management.
Takeaways
- 😀 Groundwater is the water stored beneath the Earth's surface, which can be used by living organisms for various needs.
- 😀 Groundwater is formed through rainfall that infiltrates the soil and flows under the Earth's surface due to gravity.
- 😀 The tutorial focuses on how to map groundwater potential using remote sensing techniques, specifically Landsat 8 imagery.
- 😀 The method used for groundwater analysis is the NDWI (Normalized Difference Water Index), which calculates moisture content in the soil.
- 😀 NDWI is calculated using the formula: (Green - Blue) / (Green + Blue) to determine moisture levels across the land.
- 😀 The Landsat 8 data (Bands 3 and 5) is used in this tutorial to analyze groundwater potential in the Cimahi region.
- 😀 The tutorial uses ArcMap software, setting the coordinate system to WGS84, Zone 48S, for the Cimahi region.
- 😀 The NDWI calculation is performed using the raster calculator tool in ArcMap to assess the moisture content in the region.
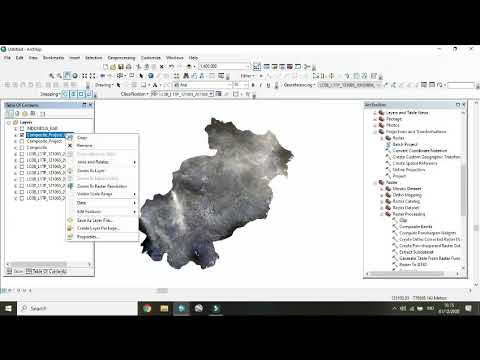
- 😀 The data is clipped to the region of interest (Cimahi) using a shapefile to focus on the specific area for analysis.
- 😀 The final groundwater potential map is classified into four categories: very high, high, medium, and low, based on the moisture content.
- 😀 Benefits of groundwater potential analysis include providing critical information for water resource management, supporting policy decisions, and aiding in sustainable development and water conservation.
Q & A
What is groundwater and why is it important?
-Groundwater is water that seeps into and is stored beneath the Earth's surface in soil and rock layers. It is crucial for sustaining life and is used for various purposes, including industrial and daily activities.
What method is used in this tutorial to analyze groundwater potential?
-The tutorial uses the EDWI method, which involves the Normalized Difference Vegetation Index (NDVI) to analyze groundwater potential. NDVI helps map soil moisture by comparing reflectance values from different spectral bands.
How is NDVI calculated?
-NDVI is calculated using the formula: NDWI = (Green - Blue) / (Green + Blue). This formula uses the green and blue bands of satellite imagery to calculate soil moisture levels.
What do the NDWI values indicate?
-NDWI values range from -1 to greater than 1. A value closer to -1 typically indicates water bodies, while values greater than 1 represent areas with high vegetation, indicating potential groundwater availability.
What type of satellite imagery is used in this tutorial?
-The tutorial uses Landsat 8 imagery, specifically Bands 3 and 5, to analyze groundwater potential in the Cimahi region.
What is the significance of using ArcMap in this tutorial?
-ArcMap is used as a Geographic Information System (GIS) tool to process satellite imagery, perform raster calculations, and create maps to visualize the groundwater potential in a specific area.
How are the results of the analysis visualized in the map?
-The results are visualized by classifying the groundwater potential into four categories: very high, high, medium, and low potential. These categories are then represented using different colors on the map.
Why is it important to clip the data to the study area?
-Clipping the data ensures that the analysis focuses only on the region of interest, in this case, the Cimahi area, by excluding any irrelevant information from outside the study boundaries.
What are the benefits of analyzing groundwater potential?
-Analyzing groundwater potential provides vital information for water resource management, helps in policy-making, and supports decision-making for sustainable water use, such as drilling wells or managing drought conditions.
What additional elements are included in the final map layout?
-The final map layout includes essential elements such as the title, scale bar, north arrow, and a legend to explain the symbology used in the groundwater potential map.
Outlines

Esta sección está disponible solo para usuarios con suscripción. Por favor, mejora tu plan para acceder a esta parte.
Mejorar ahoraMindmap

Esta sección está disponible solo para usuarios con suscripción. Por favor, mejora tu plan para acceder a esta parte.
Mejorar ahoraKeywords

Esta sección está disponible solo para usuarios con suscripción. Por favor, mejora tu plan para acceder a esta parte.
Mejorar ahoraHighlights

Esta sección está disponible solo para usuarios con suscripción. Por favor, mejora tu plan para acceder a esta parte.
Mejorar ahoraTranscripts

Esta sección está disponible solo para usuarios con suscripción. Por favor, mejora tu plan para acceder a esta parte.
Mejorar ahoraVer Más Videos Relacionados


5.0 / 5 (0 votes)
