How to Create a Soccer Pass Map in Python
Summary
TLDRThis video tutorial teaches viewers how to create soccer pass maps using Python, focusing on visualizing passes with event data. The process includes obtaining event data, importing necessary libraries, and transforming coordinates to fit a soccer pitch model. The tutorial guides users through the steps of plotting successful and unsuccessful passes using matplotlib and pandas, with further customization options for visualization. Additionally, the video introduces how to create a basic pass map and prepares the audience for adding more advanced features, like heat maps, in future content.
Takeaways
- 😀 A pass map in soccer is a visualization of passes made during a match, which can include details like the location of passes, success/failure rates, and heatmaps showing pass initiation and reception areas.
- 😀 To create a pass map, event data is required, which includes the x and y coordinates of the start and end points of each pass.
- 😀 There are several ways to obtain the required event data: purchasing it from services like YScout, manually recording it (which is tedious), or scraping it (although this can be risky and potentially illegal).
- 😀 The tutorial focuses on using Python, specifically Jupyter Notebooks, to create a pass map visualization.
- 😀 Essential Python libraries for creating the pass map include Pandas for data handling, Matplotlib for plotting, and mpl-soccer for creating the soccer pitch layout.
- 😀 The pass map will be based on data from Messi’s passes in the second half of a Barcelona vs. Real Betis game, which will be provided as a CSV file in the tutorial.
- 😀 The data needs to be scaled from a 100x100 axis (used for the raw data) to a 120x80 axis (used for the soccer pitch visualization). This is achieved by multiplying the x-values by 1.2 and the y-values by 0.8.
- 😀 To create the pass map, a base figure is set up using Matplotlib, followed by adding the soccer pitch with mpl-soccer, and inverting the y-axis to match the proper orientation of the soccer field.
- 😀 A for loop is used to plot each pass, iterating through the data frame and plotting lines between the start and end coordinates of each pass.
- 😀 The visualization distinguishes between successful and unsuccessful passes by using different colors (e.g., green for successful and red for unsuccessful). Additionally, scatter plots can be used to mark the starting points of the passes.
- 😀 Further customization of the pass map, such as adding titles, changing colors, and enhancing the visual appeal, can be done with Matplotlib commands, though basic instructions are provided in this video, with more advanced techniques to be covered later.
Q & A
What is a pass map in soccer?
-A pass map is a visualization of the passes made in a soccer game, showing where passes started and ended on the field. It can include different types of passes such as completed, progressive, and unsuccessful passes. It helps visualize player movement and passing patterns.
What type of data is required to create a pass map?
-To create a pass map, event data is required, which includes the x and y coordinates of both the starting and ending points of each pass. This data helps visualize the movement of the ball and players during the game.
What are the different ways to obtain event data for creating pass maps?
-Event data can be obtained in three ways: 1) purchasing it from services like YScout or StatsBomb, 2) manually plotting it (which is not recommended due to its tedious nature), or 3) scraping data from websites (though this method carries the risk of being banned).
Why is scraping event data considered risky?
-Scraping event data is risky because it can violate terms of service of websites, and it can lead to being banned from accessing further data. It's advised to approach this method with caution and only use it if you understand the risks involved.
What Python libraries are needed to create a pass map?
-To create a pass map, the following Python libraries are needed: Pandas for handling data, Matplotlib for plotting the pass map, MPL Soccer for creating the soccer pitch, and Seaborn for adding heat maps.
Why is it important to adjust the x and y coordinates when using event data for pass maps?
-The event data typically uses a 100x100 axis, whereas the soccer pitch used in the visualization has a 120x80 axis. The data needs to be adjusted (by multiplying the x values by 1.2 and y values by 0.8) to align with the actual pitch dimensions for proper visualization.
How is a soccer pitch visualized in Python for creating a pass map?
-The soccer pitch is visualized using the MPL Soccer library. The pitch is created by defining its size and features using predefined methods, and the passes are then plotted on this visualized pitch.
What is the purpose of inverting the y-axis in the plot?
-The y-axis is inverted because, in the pitch visualization, the y-axis starts at 0 at the top and goes to 80 at the bottom, which is the opposite of the default plotting direction. Inverting the y-axis ensures the plot reflects the real-life orientation of a soccer field.
How are successful and unsuccessful passes differentiated in the pass map?
-Successful and unsuccessful passes are differentiated using different colors. For example, successful passes can be plotted in green, while unsuccessful ones are plotted in red. This distinction helps to quickly analyze pass accuracy and player performance.
How can the pass map be customized further beyond the basic visualization?
-The pass map can be customized by adding features like titles, adjusting the appearance of the passes (e.g., changing their thickness or color), adding a heat map to show areas with the most action, and refining the overall style of the plot to enhance clarity and insight.
Outlines

This section is available to paid users only. Please upgrade to access this part.
Upgrade NowMindmap

This section is available to paid users only. Please upgrade to access this part.
Upgrade NowKeywords

This section is available to paid users only. Please upgrade to access this part.
Upgrade NowHighlights

This section is available to paid users only. Please upgrade to access this part.
Upgrade NowTranscripts

This section is available to paid users only. Please upgrade to access this part.
Upgrade NowBrowse More Related Video

Getting Started With Using Maps In Tableau | Tableau Maps For Beginners | Data Deep Dive
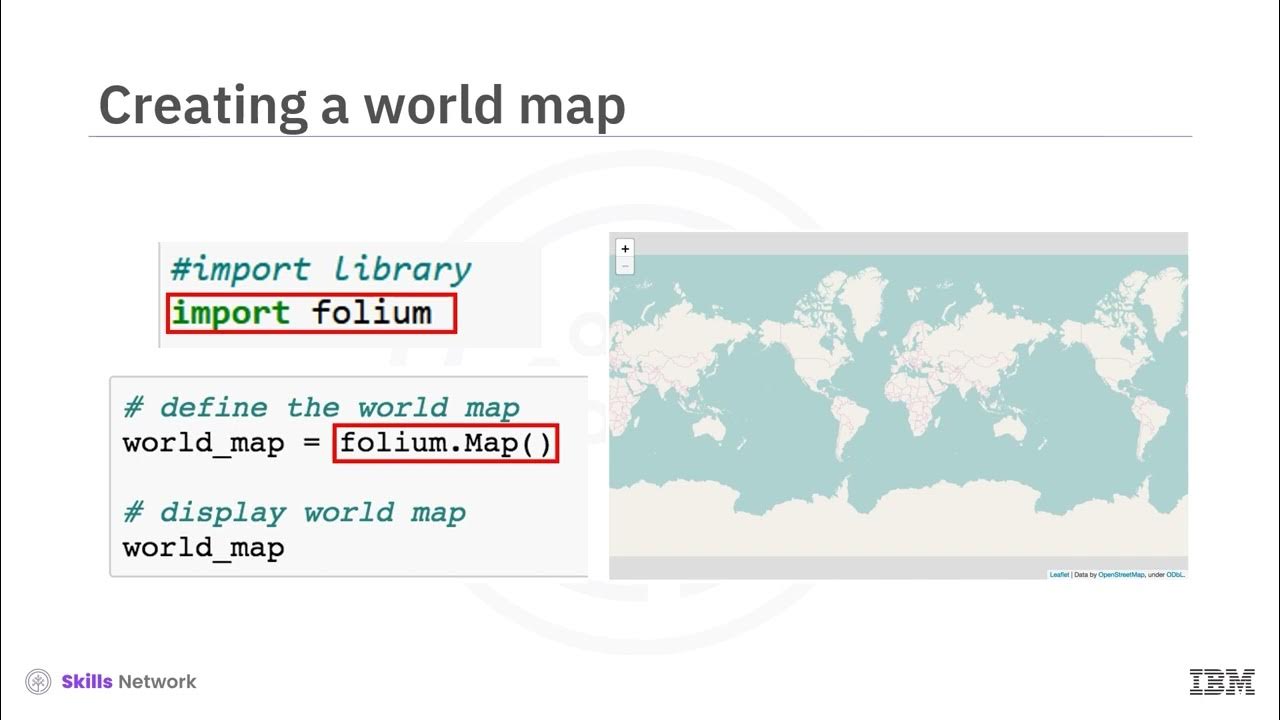
V2 Introduction to Folium V2
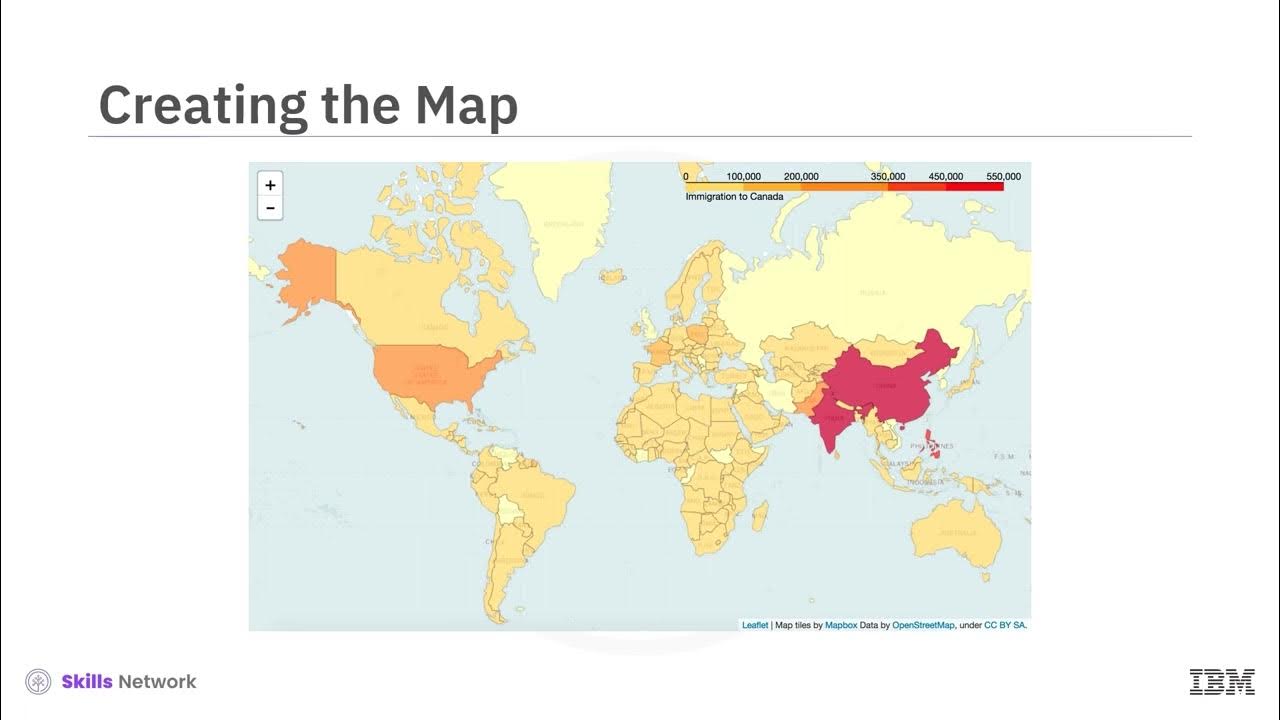
V2 Choropleth Maps

🔴 Build Your Own Blockchain | How to Create a Blockchain? | Blockchain Tutorial | Simplilearn

Pass by Value vs. Pass by Reference | Python Course #12

Cara Agar Umpan Tidak Gampang Ditebak | eFootball 2025 Mobile
5.0 / 5 (0 votes)