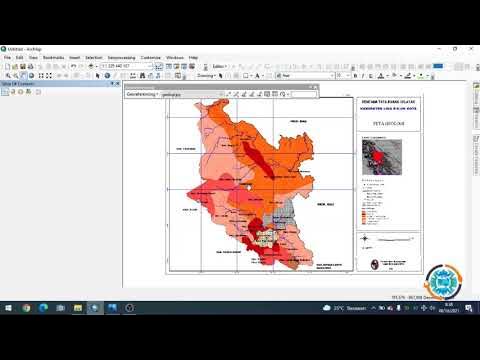
Groundwater/Aquifer Level Map in ArcGIS
Summary
TLDRIn this tutorial, viewers are guided step-by-step through the process of creating a groundwater level map using ArcGIS. The tutorial covers how to prepare and organize data, join it with shapefiles, perform interpolation using the IDW method, and adjust symbology for visual clarity. A clear and user-friendly approach is taken, making it accessible for both beginners and experienced users. Viewers will learn how to create groundwater level maps for multiple months, providing valuable insights for GIS and environmental studies. Data for practice is also available in the video description.
Takeaways
- 😀 This tutorial explains how to create a groundwater level map using ArcGIS, even for beginners.
- 😀 The data used in the tutorial includes groundwater depth measurements for 35 locations over a span of 12 months.
- 😀 The data is organized in an Excel file with columns for FID, GPS coordinates, and monthly groundwater levels.
- 😀 The Excel file is saved in CSV format and imported into ArcMap for processing.
- 😀 The tutorial demonstrates how to join data using the 'Joins and Relates' tool based on the FID field.
- 😀 Interpolation of the data is done using the IDW (Inverse Distance Weighting) method in ArcGIS.
- 😀 The process involves setting the input point features, Z-value field (groundwater level for each month), and processing extent.
- 😀 A mask is applied to restrict the analysis to the study area, ensuring the map reflects only the relevant region.
- 😀 After interpolation, the map is customized by adjusting the symbology and classification of groundwater levels.
- 😀 The process can be repeated for other months by changing the date values for each month's data.
- 😀 The tutorial emphasizes that the process is easy to follow, making it suitable for newcomers to GIS and ArcGIS.
Q & A
What is the main objective of the tutorial?
-The main objective of the tutorial is to teach viewers how to create a groundwater level map using ArcGIS, by interpolating groundwater depth data collected from 35 locations over various months.
What data is used in this tutorial to create the groundwater level map?
-The tutorial uses groundwater depth data for 35 locations, recorded from January to December, and stored in an Excel file with GPS coordinates for each location.
How should the data be formatted before importing into ArcGIS?
-The data should be formatted as an Excel file with FID (Feature ID), GPS coordinates for each collection area, and groundwater depth values for each month. This file should then be saved as a CSV file before importing into ArcGIS.
What steps are involved in joining the data in ArcGIS?
-To join the data in ArcGIS, you use the 'Joins and Relates' tool, selecting FID as the common field between the CSV file and the shapefile. This allows the groundwater depth data to be linked to the spatial features.
What is the role of the IDW interpolation method in this process?
-The IDW (Inverse Distance Weighted) interpolation method is used to create a raster surface that represents groundwater depth levels, based on the input point data (locations with known groundwater depths). It estimates groundwater depth for areas between the data points.
How do you set the processing extent in the interpolation process?
-The processing extent should be set to the study area where the analysis will be performed. This ensures that the interpolation is applied only to the region of interest, limiting the scope of the output.
What does the mask do in the interpolation process?
-The mask ensures that the interpolation is restricted to the study area by applying a boundary that limits the analysis to a defined region, preventing the generation of data outside of the area of interest.
What are the steps for customizing the symbology of the map?
-After the interpolation, right-click the raster layer, go to 'Properties', and under 'Symbology', choose the desired number of classes (e.g., 6). Then, adjust the class ranges and color scheme to clearly represent the groundwater depth levels on the map.
How can this tutorial be adapted to work for months other than January?
-To adapt the tutorial for other months, simply change the date value in the data for the specific month (e.g., February) and re-run the interpolation process for that month. Repeat the steps for each month you want to analyze.
What is the importance of comparing groundwater levels over different months?
-Comparing groundwater levels over different months allows for the analysis of seasonal changes and trends in groundwater depth, which can be valuable for understanding water availability and potential environmental impacts.
Outlines

This section is available to paid users only. Please upgrade to access this part.
Upgrade NowMindmap

This section is available to paid users only. Please upgrade to access this part.
Upgrade NowKeywords

This section is available to paid users only. Please upgrade to access this part.
Upgrade NowHighlights

This section is available to paid users only. Please upgrade to access this part.
Upgrade NowTranscripts

This section is available to paid users only. Please upgrade to access this part.
Upgrade Now5.0 / 5 (0 votes)


