SEJARAH DAN PENGERTIAN STATISTIK - STATISTIK DESKRIPTIF | BAB 1
Summary
TLDRThe transcript covers the basics of descriptive statistics, including its definition, history, and key concepts. It explains various statistical methods and processes like data collection, analysis, and presentation through tables, graphs, and measures of central tendency (mean, median, mode). It also highlights different types of data, such as qualitative and quantitative, and discusses methods of data collection like surveys, interviews, and observations. The content is geared towards understanding the essential aspects of descriptive statistics without diving into inferential statistics, providing an accessible overview of the field.
Takeaways
- 😀 Descriptive statistics involves organizing, summarizing, and presenting data in a simplified form, without drawing conclusions beyond the data itself.
- 😀 The history of statistics dates back to the 1600s with Blaise Pascal's development of probability theory, which emerged from gambling odds analysis.
- 😀 In the 1800s, Carl Friedrich Gauss introduced the normal distribution curve, a key concept still used in statistics today.
- 😀 The term 'statistics' comes from the Latin word 'status,' referring to government-related data collection, initially focused on taxation and census.
- 😀 Statistics can be defined as the collection, analysis, and interpretation of numerical data to aid in decision-making and conclusions.
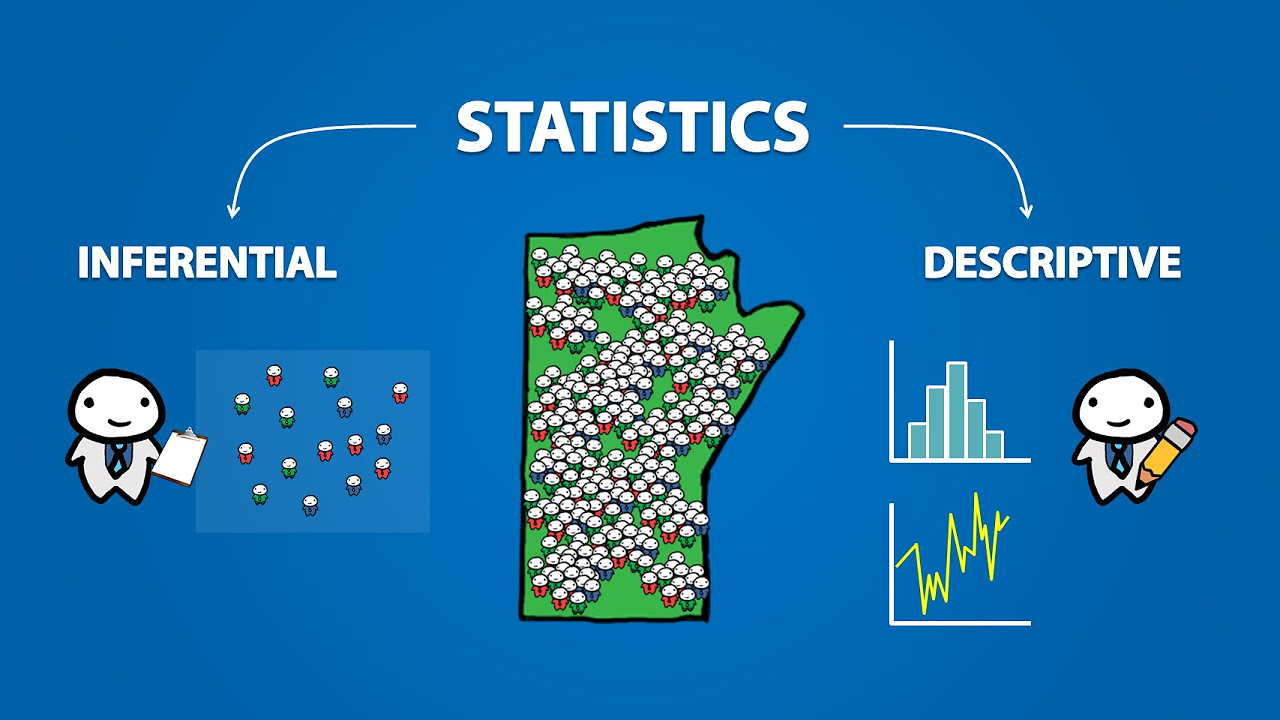
- 😀 Descriptive statistics is distinct from inferential statistics, with the latter involving generalizations and predictions beyond observed data.
- 😀 Data can be classified as qualitative (non-numeric) or quantitative (numeric), and each type has its own methods of analysis and presentation.
- 😀 Primary data is collected directly by the researcher, whereas secondary data comes from existing sources or previous studies.
- 😀 Data collection methods include surveys, interviews, observations, questionnaires, and document studies.
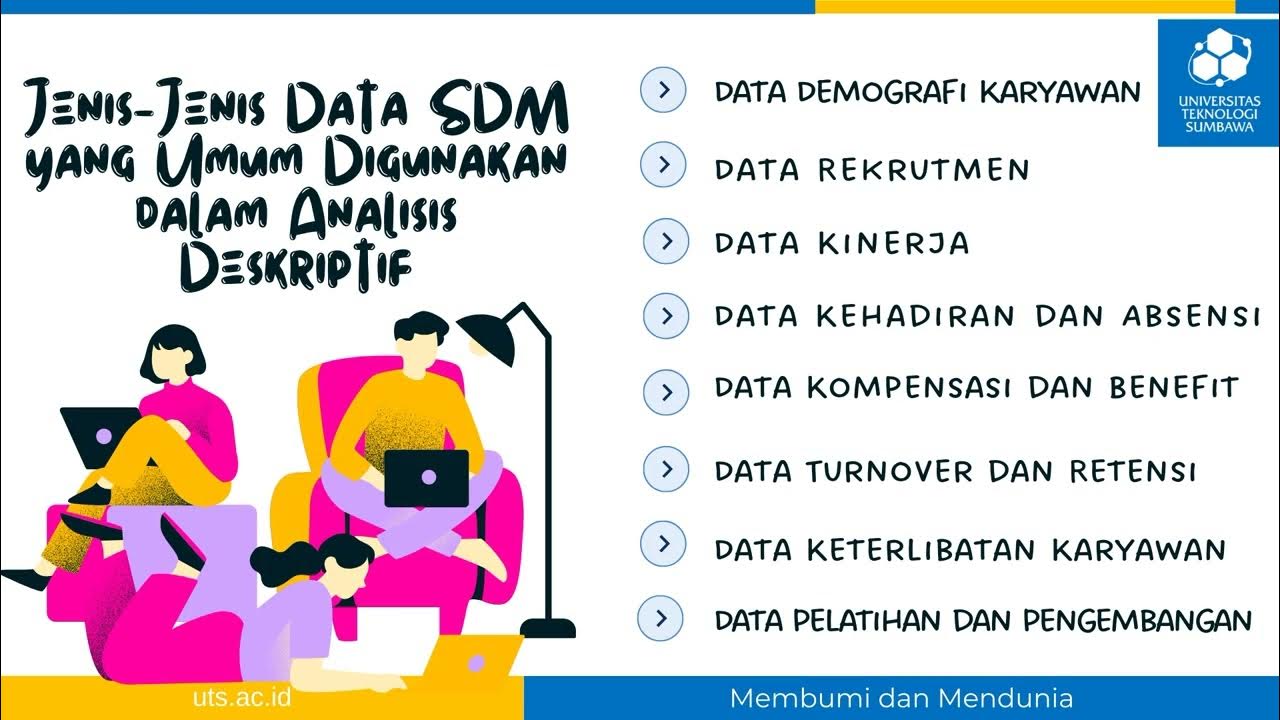
- 😀 Descriptive statistics provides an organized summary of data using tools such as tables, graphs, and numerical measures without making inferences or predictions.
- 😀 The four levels of measurement in statistics are nominal (no ranking), ordinal (ranked), interval (ordered with equal intervals), and ratio (ordered with a true zero point).
Q & A
What is descriptive statistics?
-Descriptive statistics refers to methods for collecting, organizing, summarizing, and analyzing data to make it more understandable, without drawing conclusions or making predictions.
Who were some of the key figures in the early development of statistics?
-Key figures include Blaise Pascal, who contributed to the development of probability theory, and Carl Friedrich Gauss, who introduced the normal distribution curve. Other important figures include Fisher and Lavoisier.
What is the difference between descriptive and inferential statistics?
-Descriptive statistics involves summarizing and organizing data without making generalizations, while inferential statistics uses data to make predictions or draw conclusions.
What are the main types of data discussed in the transcript?
-The transcript discusses two main types of data: qualitative data (e.g., marital status or education level) and quantitative data (e.g., income or height).
What are the key methods of data collection mentioned?
-The key methods of data collection include interviews, observations, surveys/questionnaires, and document studies.
How is qualitative data different from quantitative data?
-Qualitative data is descriptive and involves categories or labels, such as marital status or education level, while quantitative data is numerical and can be measured, such as income or height.
What are the four levels of measurement for data?
-The four levels of measurement are nominal (no ranking, e.g., gender), ordinal (ranked, e.g., competition rankings), interval (ordered categories with defined intervals, e.g., temperature), and ratio (true zero point, e.g., weight).
What is the significance of measures of central tendency in descriptive statistics?
-Measures of central tendency, such as the mean, median, and mode, provide a central or typical value for a dataset, helping to summarize the data and represent the 'average' behavior.
What is the role of measures of dispersion in data analysis?
-Measures of dispersion, such as range, variance, and standard deviation, describe the spread or variability of data, helping to understand how much the data points differ from the central tendency.
What are time-series and cross-sectional data, and how do they differ?
-Time-series data is collected over time to track changes or trends, such as monthly sales data, while cross-sectional data is collected at a single point in time to capture a snapshot of a specific situation, like survey results for a particular year.
Outlines

Esta sección está disponible solo para usuarios con suscripción. Por favor, mejora tu plan para acceder a esta parte.
Mejorar ahoraMindmap

Esta sección está disponible solo para usuarios con suscripción. Por favor, mejora tu plan para acceder a esta parte.
Mejorar ahoraKeywords

Esta sección está disponible solo para usuarios con suscripción. Por favor, mejora tu plan para acceder a esta parte.
Mejorar ahoraHighlights

Esta sección está disponible solo para usuarios con suscripción. Por favor, mejora tu plan para acceder a esta parte.
Mejorar ahoraTranscripts

Esta sección está disponible solo para usuarios con suscripción. Por favor, mejora tu plan para acceder a esta parte.
Mejorar ahora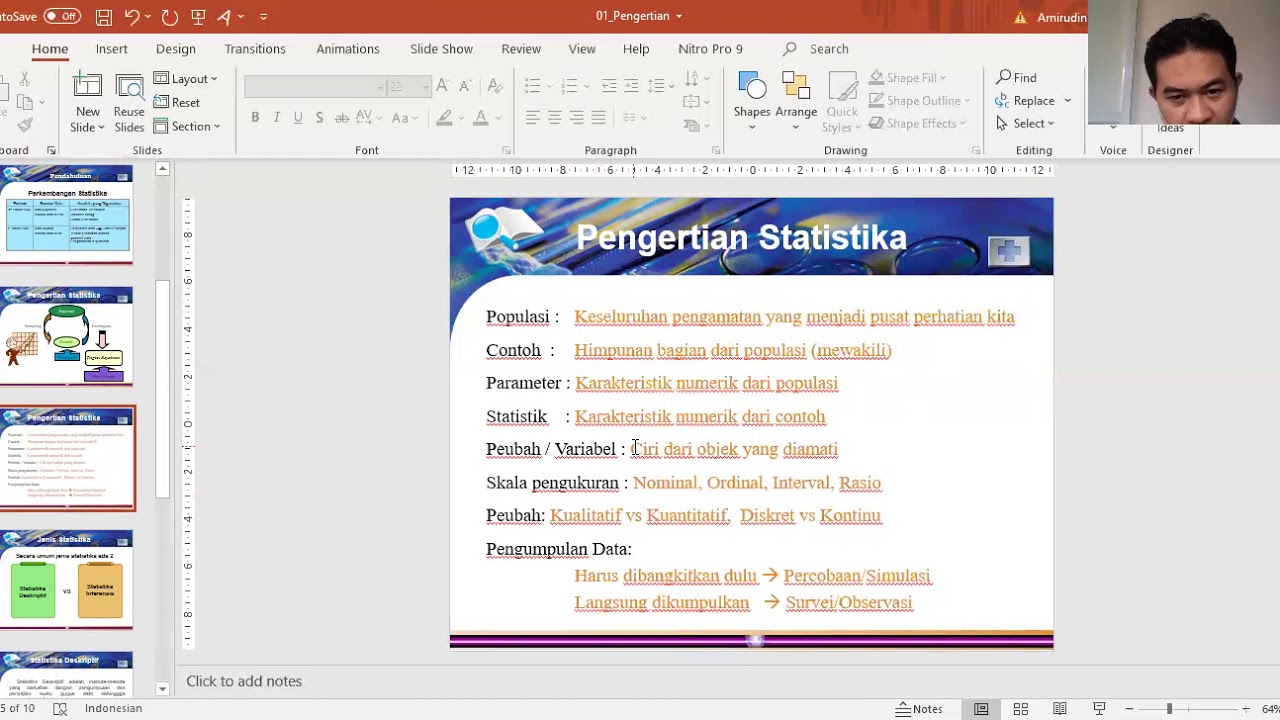


5.0 / 5 (0 votes)
