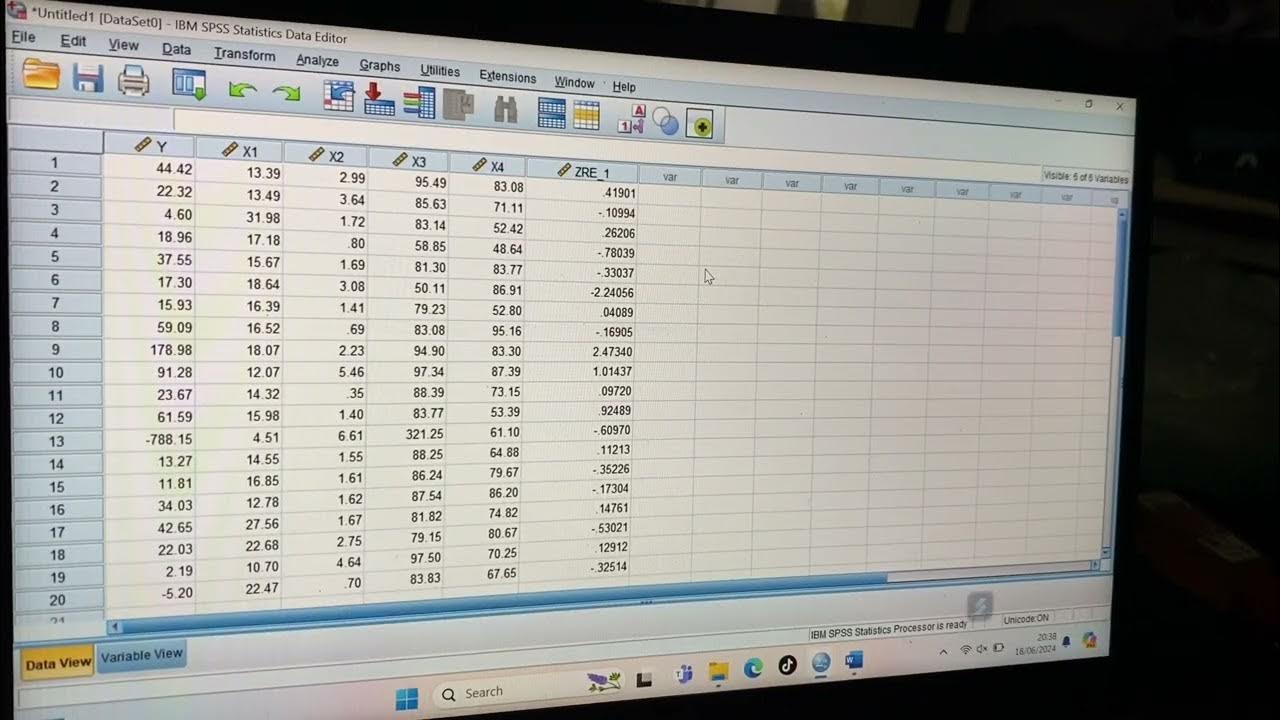
Part 1 - Cara Mengobati Uji Autokorelasi dengan SPSS || Durbin Two-Step Method
Summary
TLDRIn this tutorial video, the speaker provides a detailed explanation on how to conduct an autocorrelation test using the Durbin-Watson two-step method in SPSS. The process involves transforming data into natural logarithms and running regression analyses to identify signs of autocorrelation in time-series data. The speaker demonstrates the steps of data transformation and model testing, discussing key concepts like the Durbin-Watson statistic, critical values, and methods for resolving autocorrelation issues. The video aims to help viewers understand and apply statistical techniques to improve regression model assumptions.
Takeaways
- 😀 The video is the first in a series explaining how to perform an autocorrelation test using the Durbin-Watson Two-Step Method in SPSS.
- 😀 Autocorrelation testing is a key part of classical assumption testing in regression analysis, especially for time-series data.
- 😀 A good regression model should not exhibit autocorrelation in its residuals, as this violates the assumption of independent errors.
- 😀 If autocorrelation is detected, methods such as Cochrane-Orcutt and the Durbin-Watson Two-Step Method can be used to correct it.
- 😀 The tutorial explains how to transform data using natural logarithms in SPSS to prepare it for the autocorrelation test.
- 😀 SPSS is used to run regression analysis with transformed variables, and the Durbin-Watson statistic is checked in the output for autocorrelation.
- 😀 The Durbin-Watson statistic (DW) helps determine if autocorrelation is present by comparing it with critical values derived from a Durbin-Watson table.
- 😀 If the DW value falls between the critical values (DL and DU), there is no autocorrelation. If it is outside this range, autocorrelation is likely present.
- 😀 The tutorial demonstrates how to apply the two-step Durbin-Watson method to correct for autocorrelation by adjusting the independent variables.
- 😀 After applying the correction, a new DW value is computed, and if it falls within the acceptable range, autocorrelation is no longer present.
- 😀 The video encourages viewers to comment with questions and to like, subscribe, and share for further tutorials on statistical methods in SPSS.
Q & A
What is the primary topic of the video?
-The video discusses how to conduct an autocorrelation test using the Durbin Two-Step Method in SPSS, particularly focusing on the Durbin-Watson method to address autocorrelation issues in regression analysis.
Why is it important to test for autocorrelation in regression analysis?
-Testing for autocorrelation is crucial because a good regression model should not exhibit autocorrelation. If autocorrelation is present, it violates the assumptions of regression analysis, which could lead to incorrect conclusions.
What are the two main methods mentioned to address autocorrelation?
-The two methods mentioned for addressing autocorrelation are the Cochrane-Orcutt method and the Durbin Two-Step Method.
How many steps are involved in the Durbin Two-Step Method?
-The Durbin Two-Step Method involves two steps: First, performing a Durbin-Watson test to identify autocorrelation, and second, transforming the data using an estimation of the residuals (denoted as 'rho') to correct the autocorrelation.
What are the four types of methods available within the Durbin Two-Step Method?
-The four types of methods in the Durbin Two-Step Method are: Durbin-Watson B, Style-Nagar, Grouts-Tekwan, and Program Output Step2.
What is the purpose of transforming variables into natural logarithms (LN)?
-Transforming variables into natural logarithms (LN) is done to stabilize variance, normalize data, and potentially improve the model's performance by addressing issues such as skewness in the data.
What is the Durbin-Watson statistic, and how is it used?
-The Durbin-Watson statistic is a test statistic used to detect the presence of autocorrelation in the residuals of a regression analysis. It ranges from 0 to 4, where a value around 2 indicates no autocorrelation, a value below 2 suggests positive autocorrelation, and a value above 2 suggests negative autocorrelation.
What does it mean when the Durbin-Watson statistic falls below the lower bound (DL) or above the upper bound (DU)?
-If the Durbin-Watson statistic is below the lower bound (DL), it indicates positive autocorrelation. If it is above the upper bound (DU), it suggests negative autocorrelation. If the statistic lies between DL and DU, the result is inconclusive, and further tests may be necessary.
How is the Durbin-Watson statistic interpreted after applying the Durbin Two-Step Method?
-After applying the Durbin Two-Step Method, the Durbin-Watson statistic should ideally be closer to 2, indicating no autocorrelation. If the statistic remains outside the acceptable range, further adjustments or different methods should be considered.
What is the significance of the rho value in the second step of the Durbin Two-Step Method?
-The rho value represents the estimated residuals (or autocorrelation coefficient) from the first step of the Durbin Two-Step Method. It is used to adjust the independent and dependent variables in the second step, transforming the data to mitigate autocorrelation.
Outlines

Esta sección está disponible solo para usuarios con suscripción. Por favor, mejora tu plan para acceder a esta parte.
Mejorar ahoraMindmap

Esta sección está disponible solo para usuarios con suscripción. Por favor, mejora tu plan para acceder a esta parte.
Mejorar ahoraKeywords

Esta sección está disponible solo para usuarios con suscripción. Por favor, mejora tu plan para acceder a esta parte.
Mejorar ahoraHighlights

Esta sección está disponible solo para usuarios con suscripción. Por favor, mejora tu plan para acceder a esta parte.
Mejorar ahoraTranscripts

Esta sección está disponible solo para usuarios con suscripción. Por favor, mejora tu plan para acceder a esta parte.
Mejorar ahoraVer Más Videos Relacionados

Durbin Watson Autocorrelation Test SPSS – Classic Assumption Test

Memahami Perbedaan Uji Multikolinieritas, Heteroskedastisitas, Autokorelasi, dan Normalitas

SPSS (16): Testing the five assumptions of linear regression in SPSS

Cara Uji Normalitas dan Homogenitas Menggunakan SPSS dengan Mudah

Memahami Uji Korelasi Pearson dan Cara Analisis dengan SPSS

Tutorial Menggunakan Spss untuk data Panel
5.0 / 5 (0 votes)
