Regression and R-Squared (2.2)
Summary
TLDRThis video script delves into the concept of regression and the R-squared value, explaining how they are used to measure the linear relationship between two variables. It introduces the regression line, which predicts changes in one variable based on the other, using a formula involving the slope and y-intercept. The script also covers the practical application of these concepts, including calculating the regression line for predicting a student's GPA based on study time. It concludes with an explanation of R-squared, which measures how well the regression line fits the data, indicating the percentage of variation in the dependent variable explained by the independent variable.
Takeaways
- 📈 Regression analysis involves creating a line, known as the regression line, to represent the pattern of data and predict the change in y when x increases by one unit.
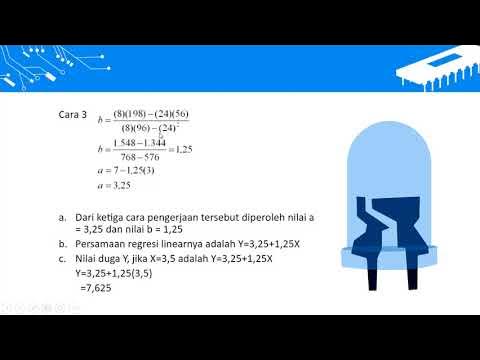
- 📚 The regression line formula is y hat = b naught + (b1 * x), where y hat is the predicted value of y, b naught is the y-intercept, b1 is the slope, and x is the value of the independent variable.
- 🔍 A positive relationship between variables, such as study time and GPA, results in an upward-sloping regression line, while a negative relationship, like time spent on Facebook and GPA, results in a downward-sloping line.
- 🧩 The values of b naught and b1 can be calculated using the formulas b naught = y-bar - (b1 * x-bar) and b1 = r * (sy / sx), where r is the correlation coefficient, and sy and sx are the standard deviations of y and x, respectively.
- 📊 To apply regression in practice, one must gather data, create a scatter plot with the dependent variable on the y-axis and the independent variable on the x-axis, and calculate the mean and standard deviations for each variable.
- ✅ The correlation coefficient (r) is essential for calculating the slope of the regression line and ranges from -1 (perfect negative correlation) to 1 (perfect positive correlation).
- 🔢 R-squared (r²) measures the proportion of the variance in the dependent variable that is predictable from the independent variable(s) and ranges from 0 (no predictability) to 1 (perfect predictability).
- 📝 R-squared can be calculated as the square of the correlation coefficient, r, and it tells us the percentage of variation in y that is accounted for by its regression on x.
- 🔑 The regression line of least squares is the line that minimizes the sum of the squares of the vertical distances of the points from the line.
- 📜 Using the regression equation, one can predict the value of y for any given value of x, as demonstrated by predicting a student's GPA based on their study time.
- 📉 A high r-squared value indicates that the regression line fits the data well, with predicted values close to actual values, while a low r-squared value suggests a poor fit and larger discrepancies between predicted and actual values.
Q & A
What is the purpose of a regression line in statistical analysis?
-A regression line, also known as the line of best fit, is used to represent the pattern of data in a graph. It predicts the change in the dependent variable (y) when the independent variable (x) increases by one unit.
How is the relationship between study time and GPA typically represented in a regression analysis?
-In regression analysis, the relationship between study time and GPA is typically represented as a positive relationship, meaning that as study time increases, GPA is expected to increase as well.
What is the formula for calculating the regression line?
-The regression line can be described using the formula: \( \hat{y} = b_0 + b_1x \), where \( \hat{y} \) is the predicted value of y, \( b_0 \) is the y-intercept, \( b_1 \) is the slope, and x is any value of the independent variable.
What does the slope of the regression line indicate?
-The slope of the regression line (\( b_1 \)) indicates the rate of change of the dependent variable (y) for each one-unit increase in the independent variable (x).
How is the y-intercept (\( b_0 \)) of the regression line calculated?
-The y-intercept (\( b_0 \)) is calculated as \( \overline{y} - b_1 \times \overline{x} \), where \( \overline{y} \) is the mean of the dependent variable and \( \overline{x} \) is the mean of the independent variable.
What is the formula for calculating the slope (\( b_1 \)) of the regression line?
-The slope (\( b_1 \)) is calculated as \( r \times \frac{s_y}{s_x} \), where r is the correlation coefficient, \( s_y \) is the standard deviation of y, and \( s_x \) is the standard deviation of x.
What is the significance of the correlation coefficient (r) in the context of regression?
-The correlation coefficient (r) measures the strength and direction of the linear relationship between two quantitative variables. It is used in the calculation of the slope (\( b_1 \)) in the regression line formula.
How can the regression line be used to predict the value of y for a given value of x?
-To predict the value of y for a given value of x, you substitute the value of x into the regression line equation and solve for \( \hat{y} \), the predicted value of y.
What is the meaning of R-squared (\( R^2 \)) in regression analysis?
-R-squared (\( R^2 \)) is a measure of how well the regression line fits the data. It represents the proportion of the variance in the dependent variable that is predictable from the independent variable.
How does R-squared (\( R^2 \)) relate to the correlation coefficient (r)?
-R-squared (\( R^2 \)) is the square of the correlation coefficient (r). It ranges from 0 to 1, with values closer to 1 indicating a better fit of the regression line to the data.
What does an R-squared value of exactly 1 imply about the regression line?
-An R-squared value of exactly 1 implies that the regression line perfectly fits the data, meaning that it can predict the value of y for any given value of x without any error.
Outlines

هذا القسم متوفر فقط للمشتركين. يرجى الترقية للوصول إلى هذه الميزة.
قم بالترقية الآنMindmap

هذا القسم متوفر فقط للمشتركين. يرجى الترقية للوصول إلى هذه الميزة.
قم بالترقية الآنKeywords

هذا القسم متوفر فقط للمشتركين. يرجى الترقية للوصول إلى هذه الميزة.
قم بالترقية الآنHighlights

هذا القسم متوفر فقط للمشتركين. يرجى الترقية للوصول إلى هذه الميزة.
قم بالترقية الآنTranscripts

هذا القسم متوفر فقط للمشتركين. يرجى الترقية للوصول إلى هذه الميزة.
قم بالترقية الآنتصفح المزيد من مقاطع الفيديو ذات الصلة

APA ITU KOEFISIEN DETERMINASI (r²) ? | CONTOH DAN PEMBAHASAN PADA OUTPUT SPSS #StudyWithTika

METODE NUMERIK 11 REGRESI LINIER

Linear Regression, Clearly Explained!!!

REGRESSION AND CORRELATION EDDIE SEVA SEE

[Mathematics in the Modern World] Correlation & Simple Linear Regression

Gráfico de dispersão no Excel
5.0 / 5 (0 votes)
