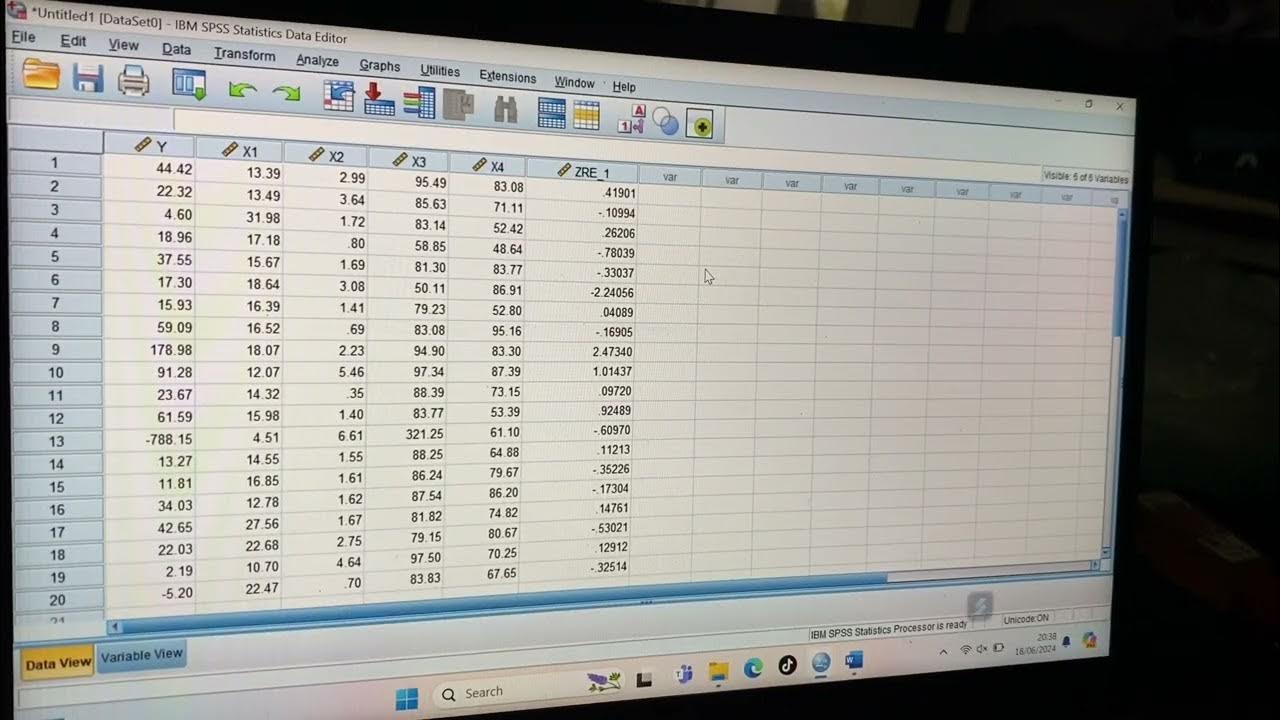
Uji Normalitas Lilifors Matkul STATISTIK 2
Summary
TLDRIn this tutorial, the presenter guides viewers through the process of performing a normality test using the Liliefors test in SPSS. Using three variables—workload, satisfaction, and employee performance—on data from 35 respondents, the steps to analyze and interpret the results are clearly explained. The tutorial highlights how to check for normality based on the p-values from the Kolmogorov-Smirnov and Shapiro-Wilk tests, concluding that all three variables in this case do not follow a normal distribution due to p-values less than 0.05.
Takeaways
- 😀 Assalamualaikum! The tutorial demonstrates how to conduct a normality test using the Liliefors test in SPSS.
- 😀 The goal of the test is to determine if three variables—workload, job satisfaction, and employee performance—are normally distributed.
- 😀 Step 1: Open SPSS and go to **Analyze > Descriptive Statistics > Explore** to begin the process.
- 😀 Step 2: Move the three variables (workload, job satisfaction, and employee performance) into the **Dependent List** in the Explore dialog box.
- 😀 Step 3: Click the **Plots** button and check the **Normality plots with tests** option before clicking **Continue**.
- 😀 Step 4: Click **OK** to run the test, and SPSS will provide the results for each variable.
- 😀 The Liliefors test uses the **Kolmogorov-Smirnov** and **Shapiro-Wilk** tests to determine normality.
- 😀 If the significance value is **greater than 0.05**, the data is normally distributed.
- 😀 If the significance value is **less than 0.05**, the data is not normally distributed.
- 😀 In the example, the significance values for all three variables (workload, job satisfaction, and employee performance) are less than 0.05, indicating that none of the variables are normally distributed.
- 😀 The conclusion is that all three variables—workload, job satisfaction, and employee performance—do not follow a normal distribution based on the test results.
Q & A
What is the purpose of performing a normality test using the Lilliefors method in SPSS?
-The purpose is to assess whether the data for each variable follows a normal distribution. This is important for ensuring that subsequent statistical analyses, which assume normality, are valid.
How many variables are being tested for normality in this tutorial?
-Three variables are being tested: workload, satisfaction, and employee performance.
How many respondents' data is being used in the normality test?
-The data from 35 respondents is used in this normality test.
What is the first step in performing a Lilliefors normality test in SPSS?
-The first step is to click on 'Analyze' in the top menu, then select 'Descriptive Statistics' and choose 'Explore'.
What should you do after selecting the variables to be tested in SPSS?
-After selecting the variables, you should move them into the 'Dependent List' to indicate that they will be tested for normality.
What option should you select to enable normality testing in SPSS?
-You should click on the 'Plots' button and then check the 'Normality Plots with Tests' box to enable the normality tests.
What does a significance value greater than 0.05 indicate in the Lilliefors test?
-A significance value greater than 0.05 indicates that the data for that variable follows a normal distribution.
What does a significance value less than 0.05 indicate in the Lilliefors test?
-A significance value less than 0.05 indicates that the data for that variable does not follow a normal distribution.
What were the results for the 'workload' variable in the Lilliefors normality test?
-The significance value for the workload variable was 0.001, which is less than 0.05, indicating that the data for workload is not normally distributed.
What were the results for the 'employee performance' variable in the Lilliefors normality test?
-The significance value for employee performance was 0.01, which is less than 0.05, meaning the data for employee performance is not normally distributed.
Can you conclude that the data for all three variables is normal?
-No, based on the results, the data for all three variables (workload, satisfaction, and employee performance) does not follow a normal distribution because their significance values are all less than 0.05.
Outlines

هذا القسم متوفر فقط للمشتركين. يرجى الترقية للوصول إلى هذه الميزة.
قم بالترقية الآنMindmap

هذا القسم متوفر فقط للمشتركين. يرجى الترقية للوصول إلى هذه الميزة.
قم بالترقية الآنKeywords

هذا القسم متوفر فقط للمشتركين. يرجى الترقية للوصول إلى هذه الميزة.
قم بالترقية الآنHighlights

هذا القسم متوفر فقط للمشتركين. يرجى الترقية للوصول إلى هذه الميزة.
قم بالترقية الآنTranscripts

هذا القسم متوفر فقط للمشتركين. يرجى الترقية للوصول إلى هذه الميزة.
قم بالترقية الآنتصفح المزيد من مقاطع الفيديو ذات الصلة

Tutorial Menggunakan Spss untuk data Panel

Uji Normalitas Shapiro Wilk Dengan SPSS

Pertemuan 6 Uji Mean One Sample T-Test

TUTORIAL SPSS : Multiple Correlation Test SPSS

Uji Asumsi Klasik SPSS Data Kuesioner beserta Analisis Regresi Linear Berganda

Cara Uji Normalitas dan Homogenitas Menggunakan SPSS dengan Mudah
5.0 / 5 (0 votes)
