FA 51 - Vertical Analysis
Summary
TLDRThis video tutorial delves into vertical analysis, a method for comparing financial statements within a single year rather than across years. The presenter uses the income statements of two companies, Gil and Hossein Inc., to demonstrate how to convert figures into percentages of sales or total assets, revealing insights into profitability and financial stability. The analysis shows Gil has better cost control and profitability, while Hossein has a stronger financial position with higher current assets and lower liabilities.
Takeaways
- 📘 The video script discusses the process of vertical analysis, a method for comparing financial statements within a single year rather than across years.
- 📊 Vertical analysis, also known as common-sized financial statements, helps to compare companies of different sizes by restating all figures as percentages.
- 🍔 The example used in the script involves comparing the financial statements of a small company, Gil, with its much larger competitor, Hossein Inc.
- 🔍 The script demonstrates how to perform vertical analysis on an income statement, with all figures expressed as a percentage of sales.
- 📈 The comparison reveals that Gil has higher profit margins and lower operating expenses as a percentage of sales compared to Hossein Inc.
- 💰 The script also shows how to apply vertical analysis to a balance sheet, with all figures expressed as a percentage of total assets.
- 🏦 The balance sheet analysis indicates that Hossein has a more stable financial position with higher current assets relative to current liabilities and a stronger equity position.
- 📉 Despite having better profitability, Gil's financial position is considered weaker due to a lower ratio of current assets to current liabilities and a higher total liabilities.
- 📚 The video script is part of a series available on a website, which includes both public and members-only content for subscribers.
- 🔗 The website mentioned in the script offers downloadable PDFs and additional video content beyond what is publicly listed on YouTube.
- 🤔 The script suggests that a viewer might prefer Gil's income statement for its profitability but would prefer Hossein's balance sheet for its financial stability.
Q & A
What is the main purpose of vertical analysis in financial statements?
-Vertical analysis is used to evaluate financial statements by expressing each item as a percentage, allowing for a comparison of the relative size of different accounts within a single year, rather than comparing across years or between different companies.
What is another term for vertical analysis?
-Vertical analysis is also commonly referred to as common-sized financial statements.
Why is it difficult to compare financial statements of companies of significantly different sizes?
-Comparing financial statements of companies of different sizes is challenging because the absolute dollar amounts do not relate well. For example, a small company with hundreds of thousands in revenue cannot be directly compared to a large company with billions in revenue.
What is the first step in performing a vertical analysis of an income statement?
-The first step in performing a vertical analysis of an income statement is to restate every item as a percentage of sales. This means dividing each item by the total sales figure.
How does vertical analysis help in comparing the profitability of two companies?
-Vertical analysis helps in comparing profitability by showing the cost structure and profit margins as a percentage of sales, which allows for a more meaningful comparison of companies of different sizes.
What does the term 'COGS' stand for in the context of financial statements?
-In financial statements, 'COGS' stands for 'Cost of Goods Sold', which represents the direct costs attributable to the production of the goods sold by a company.
What does a higher gross profit margin indicate about a company's cost control?
-A higher gross profit margin indicates that a company has better cost control, as it is able to sell its products at a higher percentage above its cost of goods sold.
How are common-sized balance sheets prepared?
-Common-sized balance sheets are prepared by expressing each item as a percentage of the company's total assets, making the total assets 100% and adjusting all other figures proportionally.
What does the ratio of current assets to current liabilities indicate about a company's short-term financial health?
-The ratio of current assets to current liabilities indicates a company's ability to pay its short-term obligations. A higher ratio suggests a stronger financial position in terms of liquidity.
What does the comparison of Hossein Inc. and Gil Ink's financial statements reveal about their respective financial positions?
-The comparison reveals that while Gil Ink has better financial performance with lower costs and higher profitability, Hossein Inc. is in a stronger financial position with a higher ratio of current assets to current liabilities and a more balanced mix of total liabilities and equity.
What is the conclusion of the vertical analysis performed on the companies in the video script?
-The conclusion is that Gil Ink has better financial performance due to lower costs and higher profitability, but Hossein Inc. has a stronger financial position with a more stable balance sheet, indicating a mixed bag of financial health for both companies.
Outlines

此内容仅限付费用户访问。 请升级后访问。
立即升级Mindmap

此内容仅限付费用户访问。 请升级后访问。
立即升级Keywords

此内容仅限付费用户访问。 请升级后访问。
立即升级Highlights

此内容仅限付费用户访问。 请升级后访问。
立即升级Transcripts

此内容仅限付费用户访问。 请升级后访问。
立即升级浏览更多相关视频
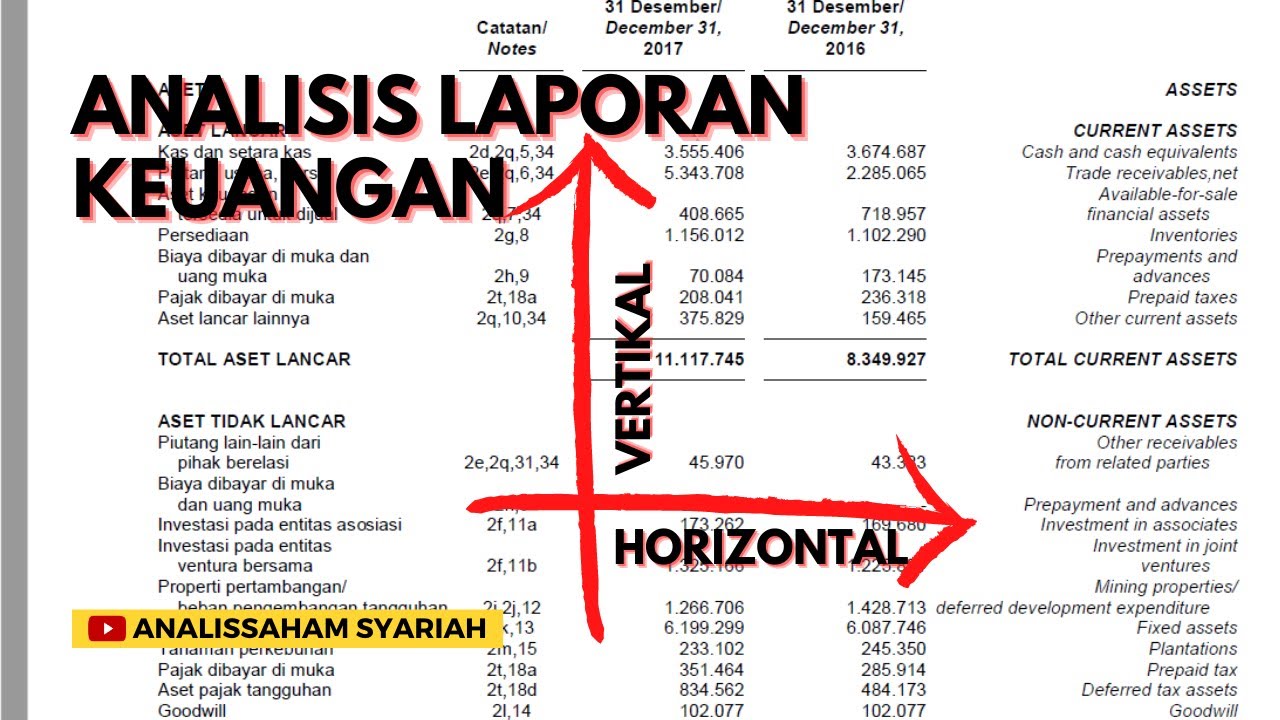
Contoh Cara Menghitung Analisis Vertikal / Horizontal Laporan Keuangan

Análisis Vertical Estado Resultados - Interpretar y Como reducir Costos y Gastos

This BROKE The Market But It's Also What Made Me RICH (Here's How)

FA22 - Accounts Receivable Explained
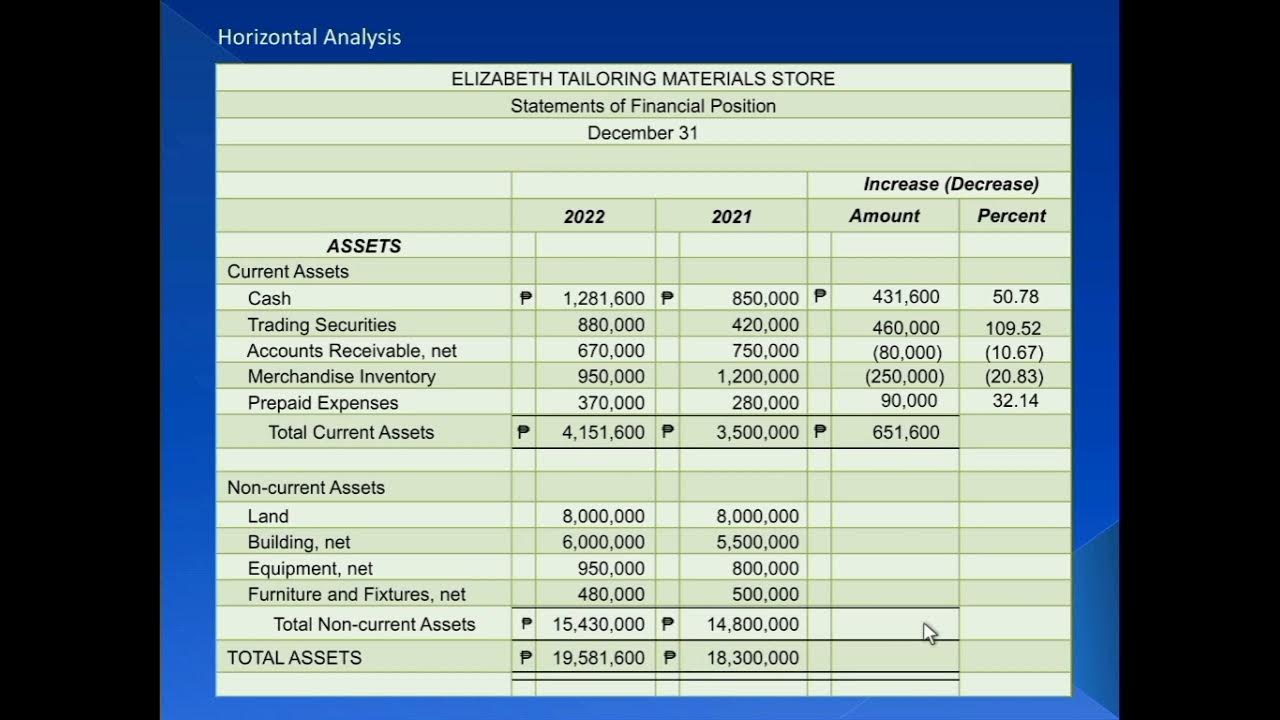
Part 1: Financial Statements Analysis (Intro, Horizontal Analysis and Vertical Analysis)

POWER AFFIRMATIONS (WARNING: Use ONLY For Good) Manifest FAST!
5.0 / 5 (0 votes)
