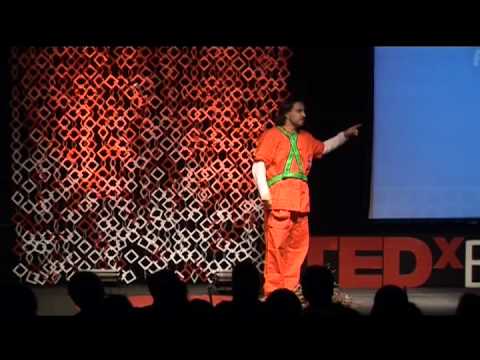
Using photos as data to understand how people live | Anna Rosling Rönnlund | TEDxStockholm
Summary
TLDRThe Dollar Street project aims to challenge travel stereotypes and socio-economic misconceptions by visualizing the world as a long street, ranging from the poorest to the richest. With over 30,000 photos from 168 families across 37 countries, it provides a detailed look into daily life, showing that similarities often lie in income levels rather than cultural differences. The project seeks to create a visual framework for understanding global socio-economic realities, using photos as data to bridge the gap between countries and promote a more nuanced view of the world's living conditions.
Takeaways
- 🌍 The speaker reflects on childhood envy of classmates' travel stories and the realization that travel snapshots often create a fairytale image of other countries.
- 📸 The idea of using photos not just as memories but as data to understand the socio-economic reality of the world is introduced through the Dollar Street project.
- 🏠 The Dollar Street project visualizes the world as a street where houses represent income levels, aiming to break stereotypes by showing the diversity within and between countries.
- 🌐 The project has documented 168 families across 37 countries, capturing 135 aspects of their homes and daily lives to provide a detailed socio-economic comparison.
- 📈 The speaker emphasizes the importance of understanding the socio-economic framework rather than relying on country stereotypes or averages.
- 📚 The Dollar Street framework aims to provide a more nuanced view of the world by allowing comparisons across different income levels and regions.
- 🔍 Detailed home documentation is conducted, with photographers spending a day in each home to capture photos, fill out questionnaires, and record daily activities.
- 📉 The project reveals a gradual improvement in living conditions as one moves from the poorest to the richest end of the Dollar Street.
- 🔑 The use of photos as data challenges country stereotypes by showing similarities in living conditions across different cultures at similar income levels.
- 🌐 The speaker envisions Dollar Street as a tool to contribute to a global understanding of socio-economic realities without the need for travel.
- 📘 The project is in its early stages, but the speaker shares initial insights that highlight the diversity within countries and the commonalities across income levels worldwide.
Q & A
What was the narrator's childhood experience with travel?
-The narrator's family didn't travel much abroad during their childhood, which led to feelings of jealousy when hearing classmates' exciting travel stories.
Why did the narrator's trip to Spain initially excite them?
-The narrator was excited because it was their first opportunity to have the same travel experiences as their classmates and to share similar stories.
What health issue did the narrator encounter during their trip to Spain?
-The narrator caught a stomach flu during their trip to Spain, which confined them to bed for most of the week.
What realization did the narrator have about travel snapshots?
-The narrator realized that even a less-than-ideal trip could produce good snapshots, leading them to question the authenticity of travel stories and the use of photos to create fairy tales about experiences.
What is the purpose of the 'Dollar Street' project?
-The 'Dollar Street' project aims to visualize the world's socio-economic reality by comparing living conditions across the income spectrum, using photos as data to break down stereotypes and understand the diversity within and between countries.
How does the 'Dollar Street' project represent income levels?
-The project represents income levels by placing households on a long street, with the poorest on the left and the richest on the right, allowing for comparisons of living conditions at different income levels.
What are the categories captured by photographers in each home for the 'Dollar Street' project?
-Photographers capture 135 different categories in each home, documenting various aspects of daily life and living conditions through photos and questionnaires.
How many families have been visited for the 'Dollar Street' project as mentioned in the script?
-As of the script, 168 families across 37 countries have been visited for the project.
What is an example of a comparison made using the 'Dollar Street' framework?
-An example given is comparing the walls of homes tagged by income, showing how they differ across income levels, and how certain household items like toothbrushes are present in varying degrees.
How does the 'Dollar Street' project plan to expand its reach?
-The project plans to create an infrastructure where more homes can be contributed, allowing for comparisons across all nations, cities, and suburbs to reveal the diversity within the world.
What is the narrator's vision for the 'Dollar Street' framework in understanding global socio-economic conditions?
-The narrator envisions 'Dollar Street' as a visual framework used alongside world maps to provide a more accurate and detailed understanding of the socio-economic reality of the world, using photos as data to reveal patterns and break stereotypes.
Outlines
🌍 The Power of Snapshots and Challenging Travel Stereotypes
The speaker reminisces about childhood envy of classmates' travel stories and the subsequent realization that travel snapshots often create idealized narratives. Despite a disappointing trip to Spain due to illness, the experience sparked a deeper reflection on how photos can shape perceptions of both our own and foreign cultures. The speaker introduces the Dollar Street project, which aims to use photography not just as a storytelling tool but as a means to understand and compare living conditions worldwide, emphasizing the importance of viewing other countries with the same nuance as our own.
🏠 The Dollar Street Project: Visualizing Global Living Standards
The Dollar Street project is described as a visual representation of the world's socio-economic spectrum, with 'house numbers' correlating to income levels. The project involves sending photographers worldwide to document homes, capturing 135 different aspects of daily life. The speaker shares insights from 168 families across 37 countries, illustrating how the project reveals the diversity within and between countries. The summary highlights the methodical approach of comparing homes side by side to understand the gradual improvements in living conditions as one moves up the 'Dollar Street,' challenging the stereotype of national homogeneity.
📈 Breaking Stereotypes with Data-Driven Photography
The speaker discusses the limitations of using country averages and stereotypes to understand living conditions, advocating for a more nuanced approach using the Dollar Street framework. By comparing specific aspects of homes, such as toothbrushing habits and kitchen utensils, the project reveals commonalities across different cultures at similar income levels. The speaker emphasizes the importance of looking beyond national borders to see the true diversity and shared experiences among people globally. The project's vision is to create an infrastructure for contributing homes to the database, allowing for a comprehensive comparison of living conditions worldwide.
Mindmap
Keywords
💡Snapshots
💡Stereotypes
💡Socio-economic Framework
💡Dollar Street
💡Home Documentation
💡Income Levels
💡Cultural Diversity
💡Comparative Analysis
💡Photo as Data
💡Global Perspective
💡Socio-economic Reality
Highlights
The speaker reflects on childhood envy of classmates' travel stories and the realization that travel snapshots often create a fairytale version of reality.
Initiation of the Dollar Street project to visualize the world's socio-economic spectrum as a long street, ranging from the poorest to the richest.
Photographers were sent worldwide to document homes, capturing 135 different aspects of daily life in each household.
Each home visit lasted a day to capture photos, fill out questionnaires, and record video snippets of family activities.
The project has documented 168 families across 37 countries, providing a diverse dataset for comparison.
The use of photos as data challenges stereotypes and allows for a more nuanced understanding of global living conditions.
Comparison of home walls across different income levels reveals the gradual improvement in living conditions.
The project aims to use photos not just for storytelling but as a data source to understand socio-economic realities.
The importance of looking beyond country averages and recognizing the diversity within each country is emphasized.
The Dollar Street framework allows for direct comparisons between homes of different countries and income levels.
The project's vision is to create an infrastructure for contributing homes to enable global comparisons and understanding.
The speaker shares early insights from the 30,000 photos collected, highlighting the socio-economic diversity within the world's population.
The project aims to provide a visual framework for understanding the socio-economic reality of the world, complementing the world map.
The speaker envisions Dollar Street as a tool for learning about the world without the need for travel.
The project challenges the traditional use of photos for fairytale storytelling and instead uses them for data-driven insights.
The importance of capturing and comparing daily activities, such as toothbrushing, to understand cultural and economic differences.
The project's approach to breaking down country stereotypes by comparing homes side by side, revealing similarities based on income rather than nationality.
The speaker's call to action for a more detailed understanding of the world, moving away from stereotypes to a data-driven perspective.
Transcripts
I remember when I was a child my family
didn't travel much abroad and I remember
the feeling after each summer break when
my classmates came back and they had all
these fantastic stories to tell they'd
been at sandy beaches they had been
visiting cool places with camels you
know all that kind of stuff
and I was a little bit jealous I have to
say then suddenly one day my father came
to me and said we were going to go on a
trip and we were going to go to Spain on
a charter and I was so happy finally I
was going to get the same experience as
all the others
I was so excited we went there
unfortunately I caught a stomach flu
which kept me in bed most of the week
but I was happy enough to have some
spare times I could go down to the beach
and take a few snapshots so coming back
to Sweden I could show my snapshots from
Spain and it looked sort of like the
snapshots my friends held in their photo
albums and there I started thinking a
little bit about that so if my crappy
trip could give me as good snapshots as
my friends how were their trip and what
did we really see when we traveled right
so I started thinking about that and
realising sort of that we use these
photos and snapshots to sort of create
these fairy tales happy moments there
are sort of true sort of notes and we
all know if you look at your own country
you know there's a wide diversity
between people you have Rachel poor you
have all these different kinds and you
would never accept someone to stare
you're talk about stereotypes about your
country grouping it all into one country
stereotype but we do that all the time
when it comes to other countries we
group
and people in other countries tend to be
like fairytale like fairytale characters
to us and we think that's fine and sort
of yeah but if we want to understand the
world we need to treat their countries
just like we treat ours so we get the
same level of detail so I remember when
I was at school my teacher used the
world map to explain how people in other
countries live and that it's sort of
okay but you don't really understand the
living conditions what we need is the
socio-economic framework and that is
currently missing but there is a huge
problem we need to use statistics and we
all know what people think about
statistics they hate it usually we use
photos as illustrations to create these
fairytale stories about our lives but
maybe that is not the best way of doing
it what if we could use photos as data
so I decided to start a project called
the dollar Street and imagine the world
as a long street you have the poorest to
the left
the richest to the right and everybody
else live in between something like this
the house numbers represent the income
level you have and where you live you
will find neighbors from all over the
world
the interesting part would be if we
could visit families right and see what
it looks like in different homes because
in each block you will find people from
all different countries all different
regions and all different cultures so I
sent out photographers across the world
to do home documentation and I'm going
to show you a little bit about that what
is a home well a home is the place where
we eat go to the toilet and sleep but we
do quite a lot of other things as well
and these are the categories the
photographer's capture in each and every
home 135 things they capture by photo
every home they visit they spend about a
day so to take all the snapshots to get
the questionnaire filled out about the
household and the family and to take
some video snapshots following the
family and their daily activities they
spend a day there and these are the
families we have currently visited it's
168 families spread across 37 countries
and we can see now we are in the upper
corner of the dollar Street among the
richest and now we move down and see
here are the families so to show you an
example this is the llama family in
Nepal these are the pictures we captured
in their home and here's the wall this
is one of the snapshots from their home
and what we can do then since this wall
is tagged by income we can compare it
with other walls like this and we can
see how walls differ across income we
have the poorest wall to the left and
the richest to the right and we can see
how they look a little bit different and
the gradually improves but not all
things are good to capture by photo some
things works better on video like
activities so I'm going to show you an
example of that toothbrushing we start
at the top
you
so when the photographer asked this
woman where is your toothpaste because
he needed a snapshot of the toothpaste
she pointed at her wall this is not only
her wall it's also her toothpaste so if
we recap of the tooth brushing category
we can see that at the lower end of
Dollar Street you don't have a
toothbrush maybe a steak as you come up
you'll start having toothbrushes and
when you come up to the richest part you
start having one each so now we have an
idea about what we're going to capture
needs all these countries and all these
homes but what we need is to define a
first set of homes so they are
proportional to the world population we
start by doing hundred homes so we look
at the world map we can see fifty-nine
percent the world population are in
China now and the rest of the Asian
countries meaning we need to have 59 of
the homes from Asia then when we look at
the income we can see the income spreads
like this
these are income mountains you can say
and you see how they spread you
transform it into houses you put them on
the street and you can see there's a
huge density in the middle and they're
spread out so to make it easier to
understand we can take an example let's
look at us these are the US homes the
five green ones and that they are five
then means that US is five percent of
the world population more or less this
is the income Mountain of us if we look
at this family
this family is a representative for the
richest 20% in the u.s. group and here's
their home the name is Howard's and we
can go inside and we can see all these
hundred and thirty five functions and we
can see them bar brushing their teeth
and washing their hands and so on but it
doesn't really make sense just looking
at one home it's when we start comparing
we learn things
so we add this woman as well the family
Hadleys they are in the poorest quintile
as the poorest house down here and we
can start comparing so I would suggest
we start by looking in their cutlery
drawer and we would do that we can see
there's a huge difference she stores her
in a green box while the others has like
really luxury box you can see they even
have a small box within the box for the
tiniest the silverware we now see the
two extremes and we always hear about
there's a huge gap between the poor and
the rich and so on and that's true but
looking at the income mounting we see in
the middle we see most people actually
live in the middle so it makes sense to
add one more cutlery drawer so we do
that and we can see that there is a
gradual improvement and we can do that
for other aspects as well looking at the
kitchen sink or the living room we can
see a gradual improvement of course we
can do this for many countries if we do
it for China for instance here three
homes three families we see their house
type we see the sofas they're using and
we see the stoves as you can see there
is a huge variety within a country so
using country averages and is sort of a
stereotypical way of explaining how
people live and we know we've heard many
times that you is is richer than China
and that is true when it comes to
averages but if we put them on top of
each other we can see that the overlap
is quite big so the exciting part here I
think as using the dollar suite
framework to start looking at neighbors
and comparing their so let's go visit
these two families it's the vu and the
Howard and see their kitchen the
standards are sort of the same look at
the play structures identical and the
beds sort of the same of course we can
do this in the other end of China as
well so we go down to this woman we saw
previously and
we look at her neighbor it's a family
from Nigeria so let's see what they have
in common on that income level well it's
the Leung and they are liberal joy they
have the same type of roofs and ceilings
constructed by natural material with
plastics on top the same type of chairs
they store their grains in as exact same
way both are having fish for dinner and
they boil their water on identical
stoves so if we were visiting this
Chinese family seeing that stove I think
we might draw the conclusion that we
learnt something about the Chinese
culture but when you see them next to
each other you sort of realize this
might not be culture maybe this is
rather an income question so by using
photos as data suddenly country
stereotypes fall apart so what we're
planning to do with the doors root
framework is to create an infrastructure
where you can contribute with homes
because we want it to be possible to
compare all nations all cities and even
all suburbs to see the diversity within
the world and it's when we can start
comparing across country borders with
darka see interesting patterns these are
my main photographers and without them
we would have had nothing today
they had been really hard working and
I'm so happy and when I'm looking
through the material they sent me that
now I have more than 30 thousand photos
to go through so it's sort of a task to
bring some order into this but going
through it I've got some first like
insights that I would like to share with
you and remember it's early in the
process working process so it's quite
rough but I think it's worth sharing it
so first of all remember that this is
the world population most people live in
between stop thinking about the poorest
and richest okay imagine that you were
one of the three billion people in the
middle
what would your life look like now maybe
it would look something like this
when you go to bed in the evening you
brush your teeth with the same
toothbrush as the rest of the family
members and you're dreaming about the
day when you don't have to share the
toothbrush with Grandma anymore you go
and lock the door
using the padlock and then the light
might be flickering because the
electricity is unstable sometimes you
have to rely on moonlight if you want to
read in the night you get into the bed
together with the rest of the family
members and at least you're happy you're
not sleeping on the floor your house has
a patchwork roof so if it's raining you
will get wet and cold while in bed with
the rest of the family when you go to
the toilet you're at least happy even
though it's smelly and full of flies
you're happy that you have something
that keeps your privacy some kind of
wall so that you don't have to use the
field or a bush and then you go in and
grab water for repairing for breakfast
you have to walk for a bit and it's
heavy to carry but it's worth it
because you're going to get this dish
the middle one and it's the same dish
you have for all meals a day all meals a
week most of your life and you're
dreaming about a day when your food can
start become something delicious
not only nutritious so by doing this
kind of comparisons look at it we can
start getting a view about how the world
is when it comes to home functions and
we don't even mention the countries here
it's sort of rough segmentations of how
we organize our lives so my vision is
the Dollar Street will become a visual
framework that we use together with
their world map to understand the
socio-economic reality of the world so
by using photos as data we can finally
understand how other people
of without traveling thank you
浏览更多相关视频
How many are rich and how many are poor by Professor Hans Rosling
Global Wealth Inequality - What you never knew you never knew (See description for 2017 updates)
Why Cities Exist
Casually Explained: Photography
4/8 Elgard - Grand Final of Indonesia Open 2023
"HUGE GOLD NEWS FROM CHINA! What's Coming Is Bigger Than Imagined" - Andy Schectman
5.0 / 5 (0 votes)