How do you make a Haigh (Goodman) and Smith fatigue limit diagram?
Summary
TLDRThis video explores the creation and interpretation of Hay and Smith fatigue strength diagrams, essential tools for understanding material behavior under varying mean stresses. It explains how fatigue tests generate Wöhler curves, their limitations, and why Hay (Goodman) and Smith diagrams offer clearer insights. Key concepts such as alternating fatigue limit, tensile and yield strength, Goodman lines, and permissible stress areas are discussed, along with extensions to compressive loading. The video provides a step-by-step explanation of how these diagrams define safe stress amplitudes for long-term operation, helping engineers design components that resist fatigue while avoiding plastic deformation.
Takeaways
- 😀 Fatigue strength diagrams, like the Hay and Smith diagrams, help evaluate the fatigue strength of materials under dynamic loading conditions.
- 😀 The Wer curve is useful for evaluating fatigue but doesn't account for varying mean stresses, which are common in practice.
- 😀 The Hay diagram (Goodman diagram) plots the stress amplitude against the mean stress to show the effect of mean stress on fatigue strength.
- 😀 The Goodman line is an approximation of the Hay curve and provides a conservative estimate of fatigue strength.
- 😀 The Yield Line limits the fatigue strength based on the material's yield point, not tensile strength.
- 😀 The Smith diagram also visualizes fatigue strength, focusing on the maximum and minimum stress values in relation to the mean stress.
- 😀 Both Hay and Smith diagrams rely on three material parameters: alternating fatigue limit, tensile strength, and yield point.
- 😀 In practice, the Goodman line runs below the Hay curve, resulting in smaller stress amplitudes, thus ensuring a safety margin.
- 😀 Stress ratios (e.g., -1 for pure alternating load, 1 for static load) help simplify the understanding of fatigue endurance in both diagrams.
- 😀 In the case of compressive loading, the Smith diagram uses compressive yield points to limit the minimum stress, unlike tensile loading which uses tensile yield points.
- 😀 Graphical representation of fatigue limits using the Hay and Smith diagrams helps engineers determine the permissible stress ranges for materials under different loading conditions.
Q & A
What is the main limitation of Wöhler (S-N) curves in practical engineering applications?
-Wöhler curves only apply to a specific mean stress and do not account for variable mean stress conditions, which often occur in real-world applications. This limits their usefulness for predicting fatigue behavior under changing loads.
What is the purpose of Hay and Smith diagrams in fatigue analysis?
-Hay and Smith diagrams are used to illustrate the influence of mean stress on fatigue strength in a clear and practical way, providing engineers with the permissible stress ranges under varying mean stress conditions.
How is a Hay diagram (Goodman diagram) constructed?
-A Hay diagram is constructed by plotting the stress amplitude against mean stress. Key points include the alternating fatigue limit at zero mean stress (σ_AF) and the tensile strength at zero stress amplitude (σ_UTS). Additional fatigue tests at different mean stresses define the curve, which can be approximated by the Goodman line.
What simplification is often used in the Hay diagram to save testing effort?
-The Hay curve is often approximated by a straight line called the Goodman line, which runs below the actual curve, providing a safety margin while simplifying the determination of permissible stress amplitudes.
What is the significance of the yield line in a Hay diagram?
-The yield line, drawn at a 45° angle when axes are equally scaled, limits the area of technically permissible fatigue endurance. It ensures that the sum of mean stress and stress amplitude does not exceed the material's yield point, preventing plastic deformation.
How does the Smith diagram represent fatigue endurance differently from the Hay diagram?
-The Smith diagram plots maximum stress (σ_max) versus minimum stress (σ_min) instead of stress amplitude versus mean stress. It defines the boundaries of the fatigue endurance area for given mean stresses and allows direct reading of permissible maximum, minimum, and stress amplitudes.
Which material parameters are needed to fully define both Hay and Smith diagrams?
-The alternating fatigue limit (σ_AF), tensile strength (σ_UTS), and yield strength (σ_Yield) are required to define the diagrams completely.
How is the stress ratio defined and what are its important special cases?
-The stress ratio R is defined as the quotient of minimum to maximum stress (R = σ_min / σ_max). Important cases include: R = -1 for purely alternating loads, R = 1 for static loads, and R = 0 for purely pulsating loads.
Can Hay and Smith diagrams account for compressive stresses?
-Yes, both diagrams can be extended to negative mean stresses. In this case, the compressive yield point (σ_CY) limits the permissible stress, and the fatigue limits for compressive loads are shown similarly to tensile loads.
Why does compressive loading generally allow higher fatigue limits than tensile loading?
-Compressive loading tends to close cracks rather than propagate them, which inhibits crack formation. Therefore, materials, particularly lamellar graphite castings, can endure higher stress amplitudes under compression than under tension.
How is the stress amplitude calculated in a Smith diagram?
-In a Smith diagram, the stress amplitude (σ_a) is half of the difference between maximum and minimum stress: σ_a = (σ_max - σ_min) / 2.
What is the role of the dash-dotted line in the Smith diagram?
-The dash-dotted line represents the mean stress, calculated as σ_m = (σ_max + σ_min) / 2, and is used to symmetrically relate the maximum and minimum stress lines within the diagram.
Outlines

此内容仅限付费用户访问。 请升级后访问。
立即升级Mindmap

此内容仅限付费用户访问。 请升级后访问。
立即升级Keywords

此内容仅限付费用户访问。 请升级后访问。
立即升级Highlights

此内容仅限付费用户访问。 请升级后访问。
立即升级Transcripts

此内容仅限付费用户访问。 请升级后访问。
立即升级浏览更多相关视频
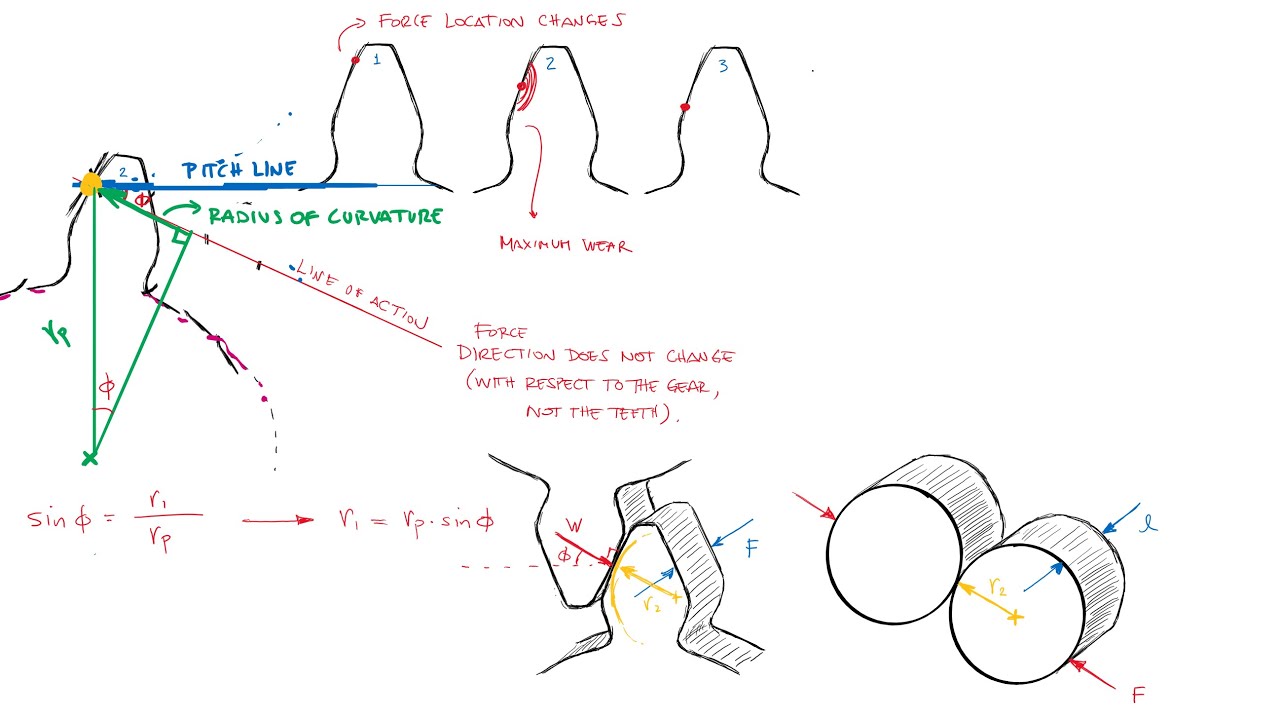
Gear PITTING - Surface Contact Stress Fatigue Failure in Just Over 10 Minutes!

Failure Fatigue and Creep
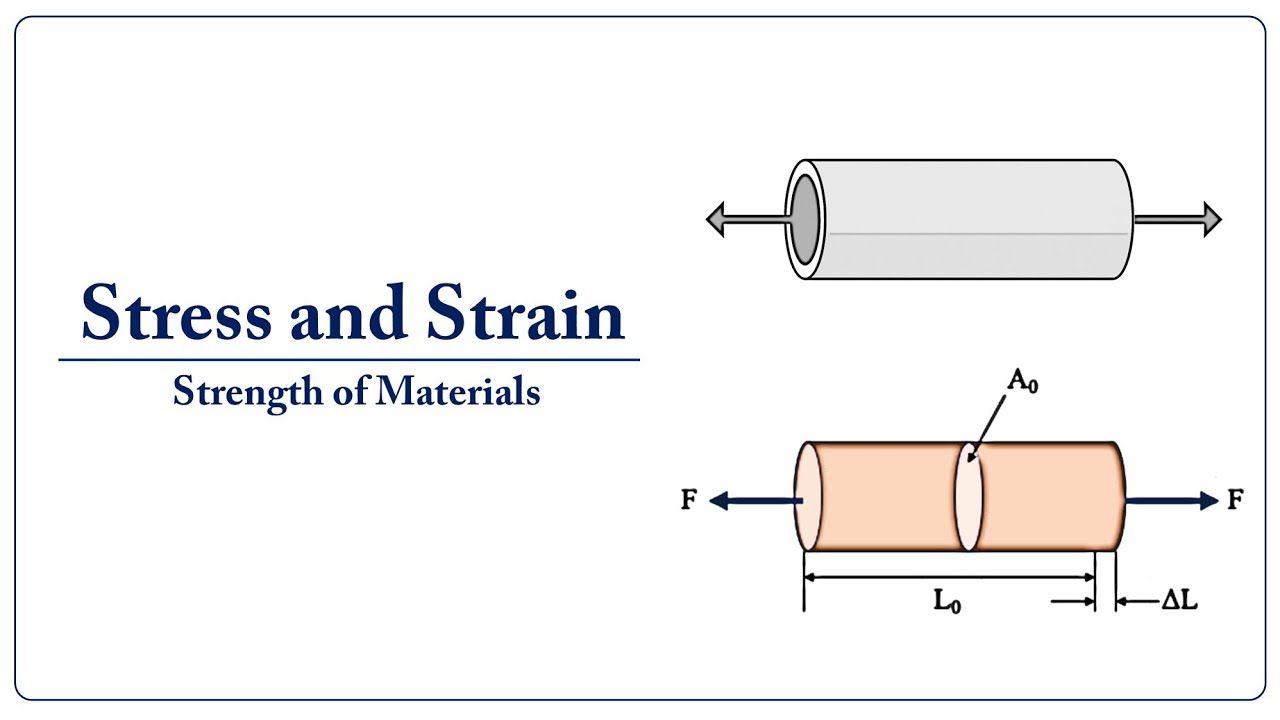
Stress and Strain | Stress strain curve of mild steel | Mechanical Properties of Solids |

Fatigue STRESS CONCENTRATIONS in Just Over 10 Minutes!

Mechanics of Materials: Lesson 16 - Fatigue and Creep Failures with S-N Diagram

Heat Treatment - Types (Including Annealing), Process and Structures (Principles of Metallurgy)
5.0 / 5 (0 votes)
